Lander County graduated two out of every three seniors in 2021. Three years later, it graduated nine out of 10. That 24-point swing, from 66.7% to 90.7%, is extraordinary by any measure. It made no difference at all.
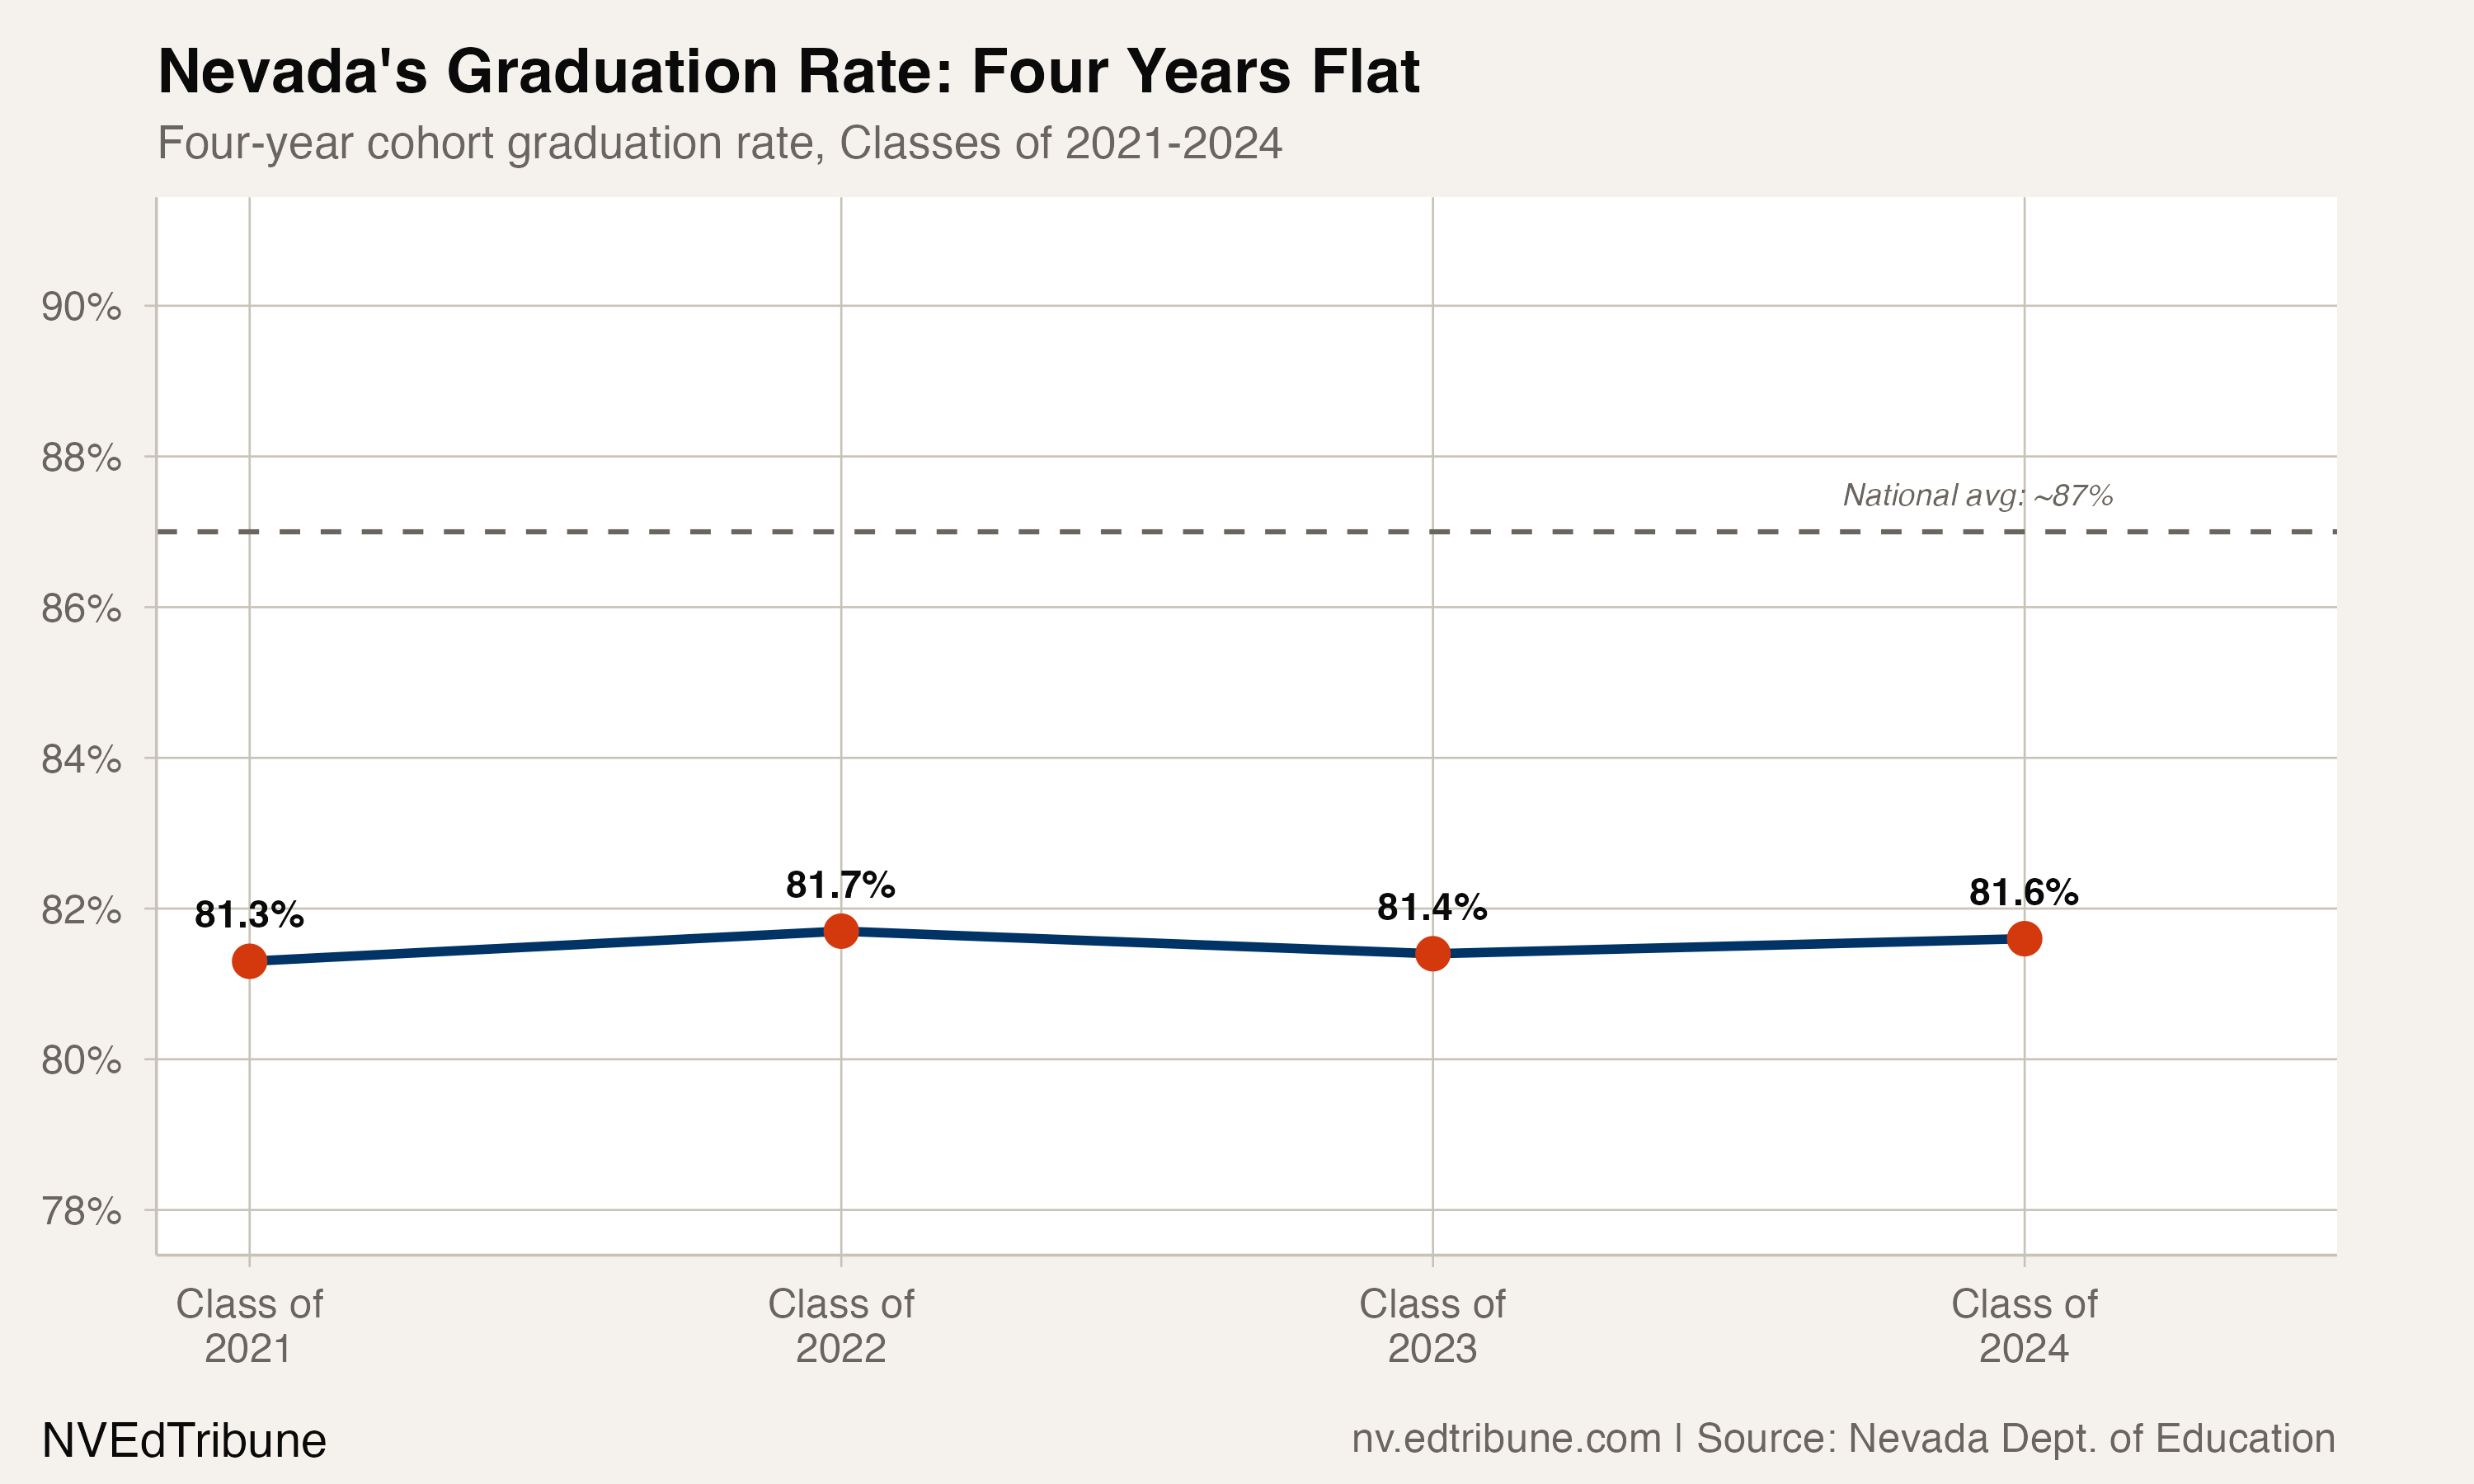
Nevada's statewide four-year graduation rate in 2024 was 81.6%, virtually identical to the 81.3% recorded in 2021. The total range across four consecutive cohorts: 0.4 percentage points. Lander's dramatic improvement, along with gains in White Pine (+7.4 points), Churchill (+4.2), and Douglas (+3.6), vanished into the arithmetic of a state where Clark County↗ET alone enrolls about 68% of all high school seniors.
The national four-year adjusted cohort graduation rate sits at approximately 87%. Nevada trails that benchmark by 5.4 points, a gap that has persisted for the better part of a decade and shows no sign of closing in the cohort data.
What held the line
The plateau was not the product of stagnation everywhere. It was the product of offsetting movements that canceled each other out.
Clark County, the state's dominant district at 81.5% in 2024, barely budged over four years (+0.6 points from 80.9%). Washoe County, the second-largest system, actually slipped, falling from 82.5% to 81.9%. Together, these two districts educate the overwhelming majority of Nevada's high school students. When they flatline, the state flatlines.
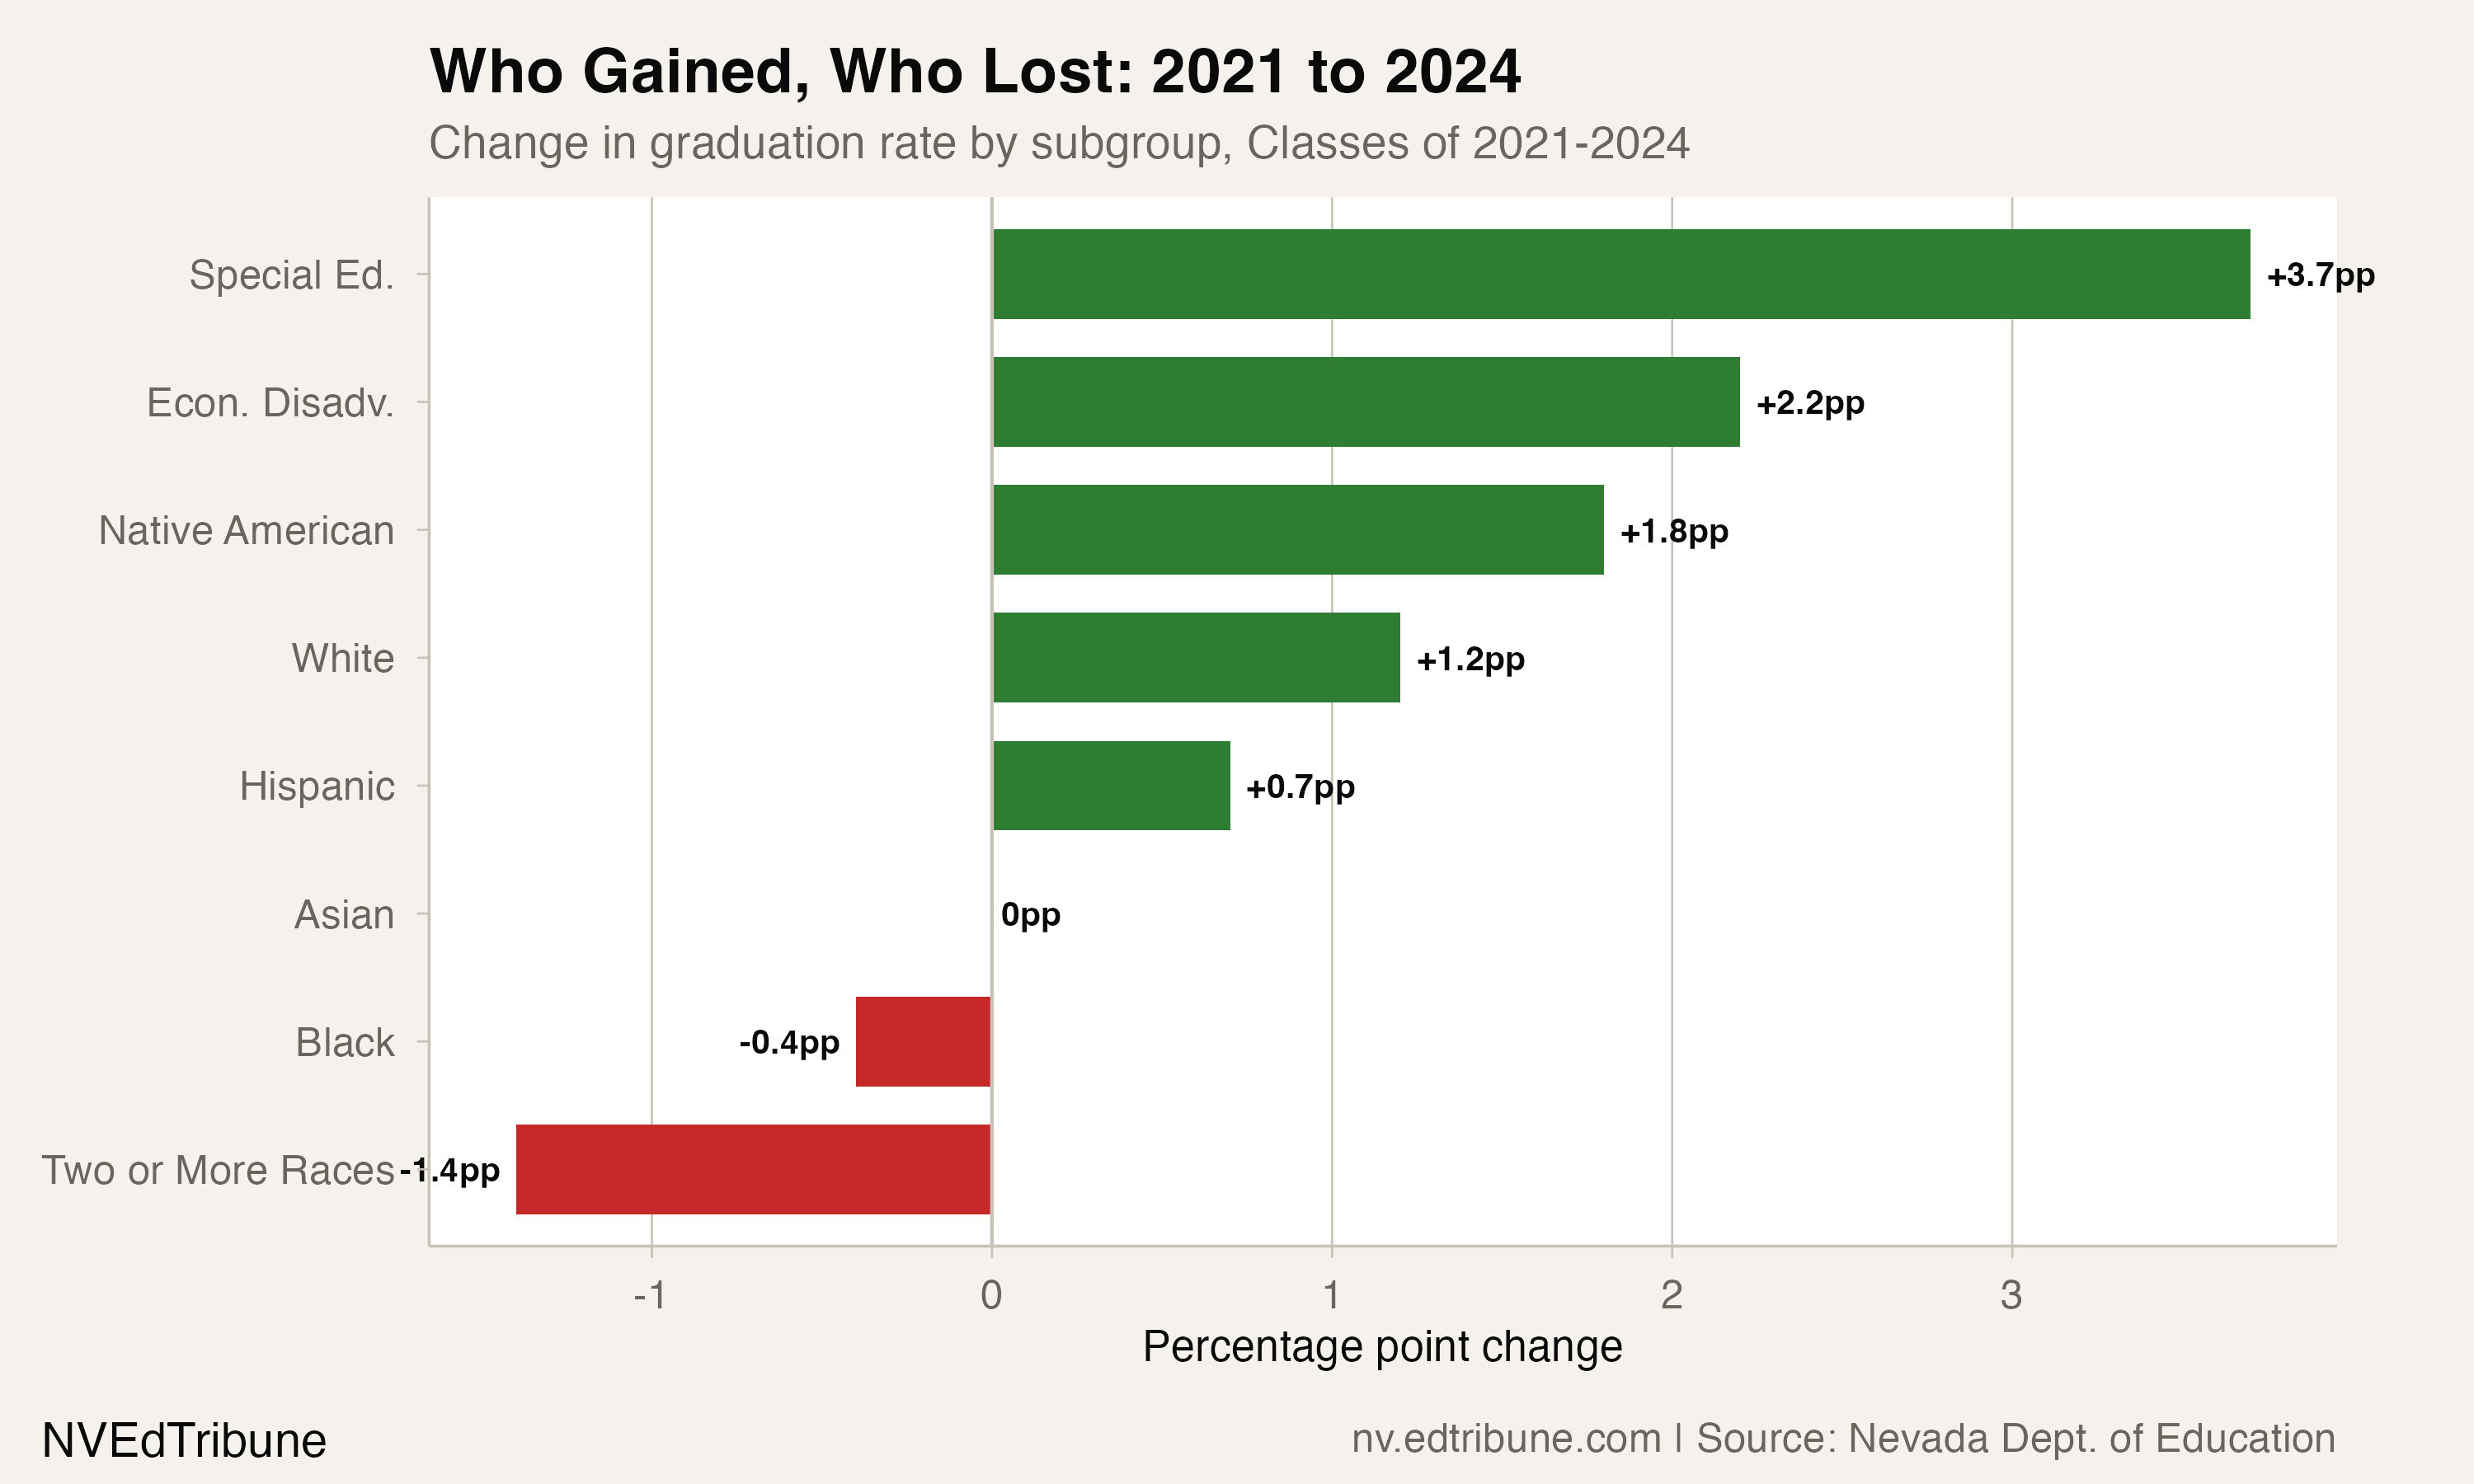
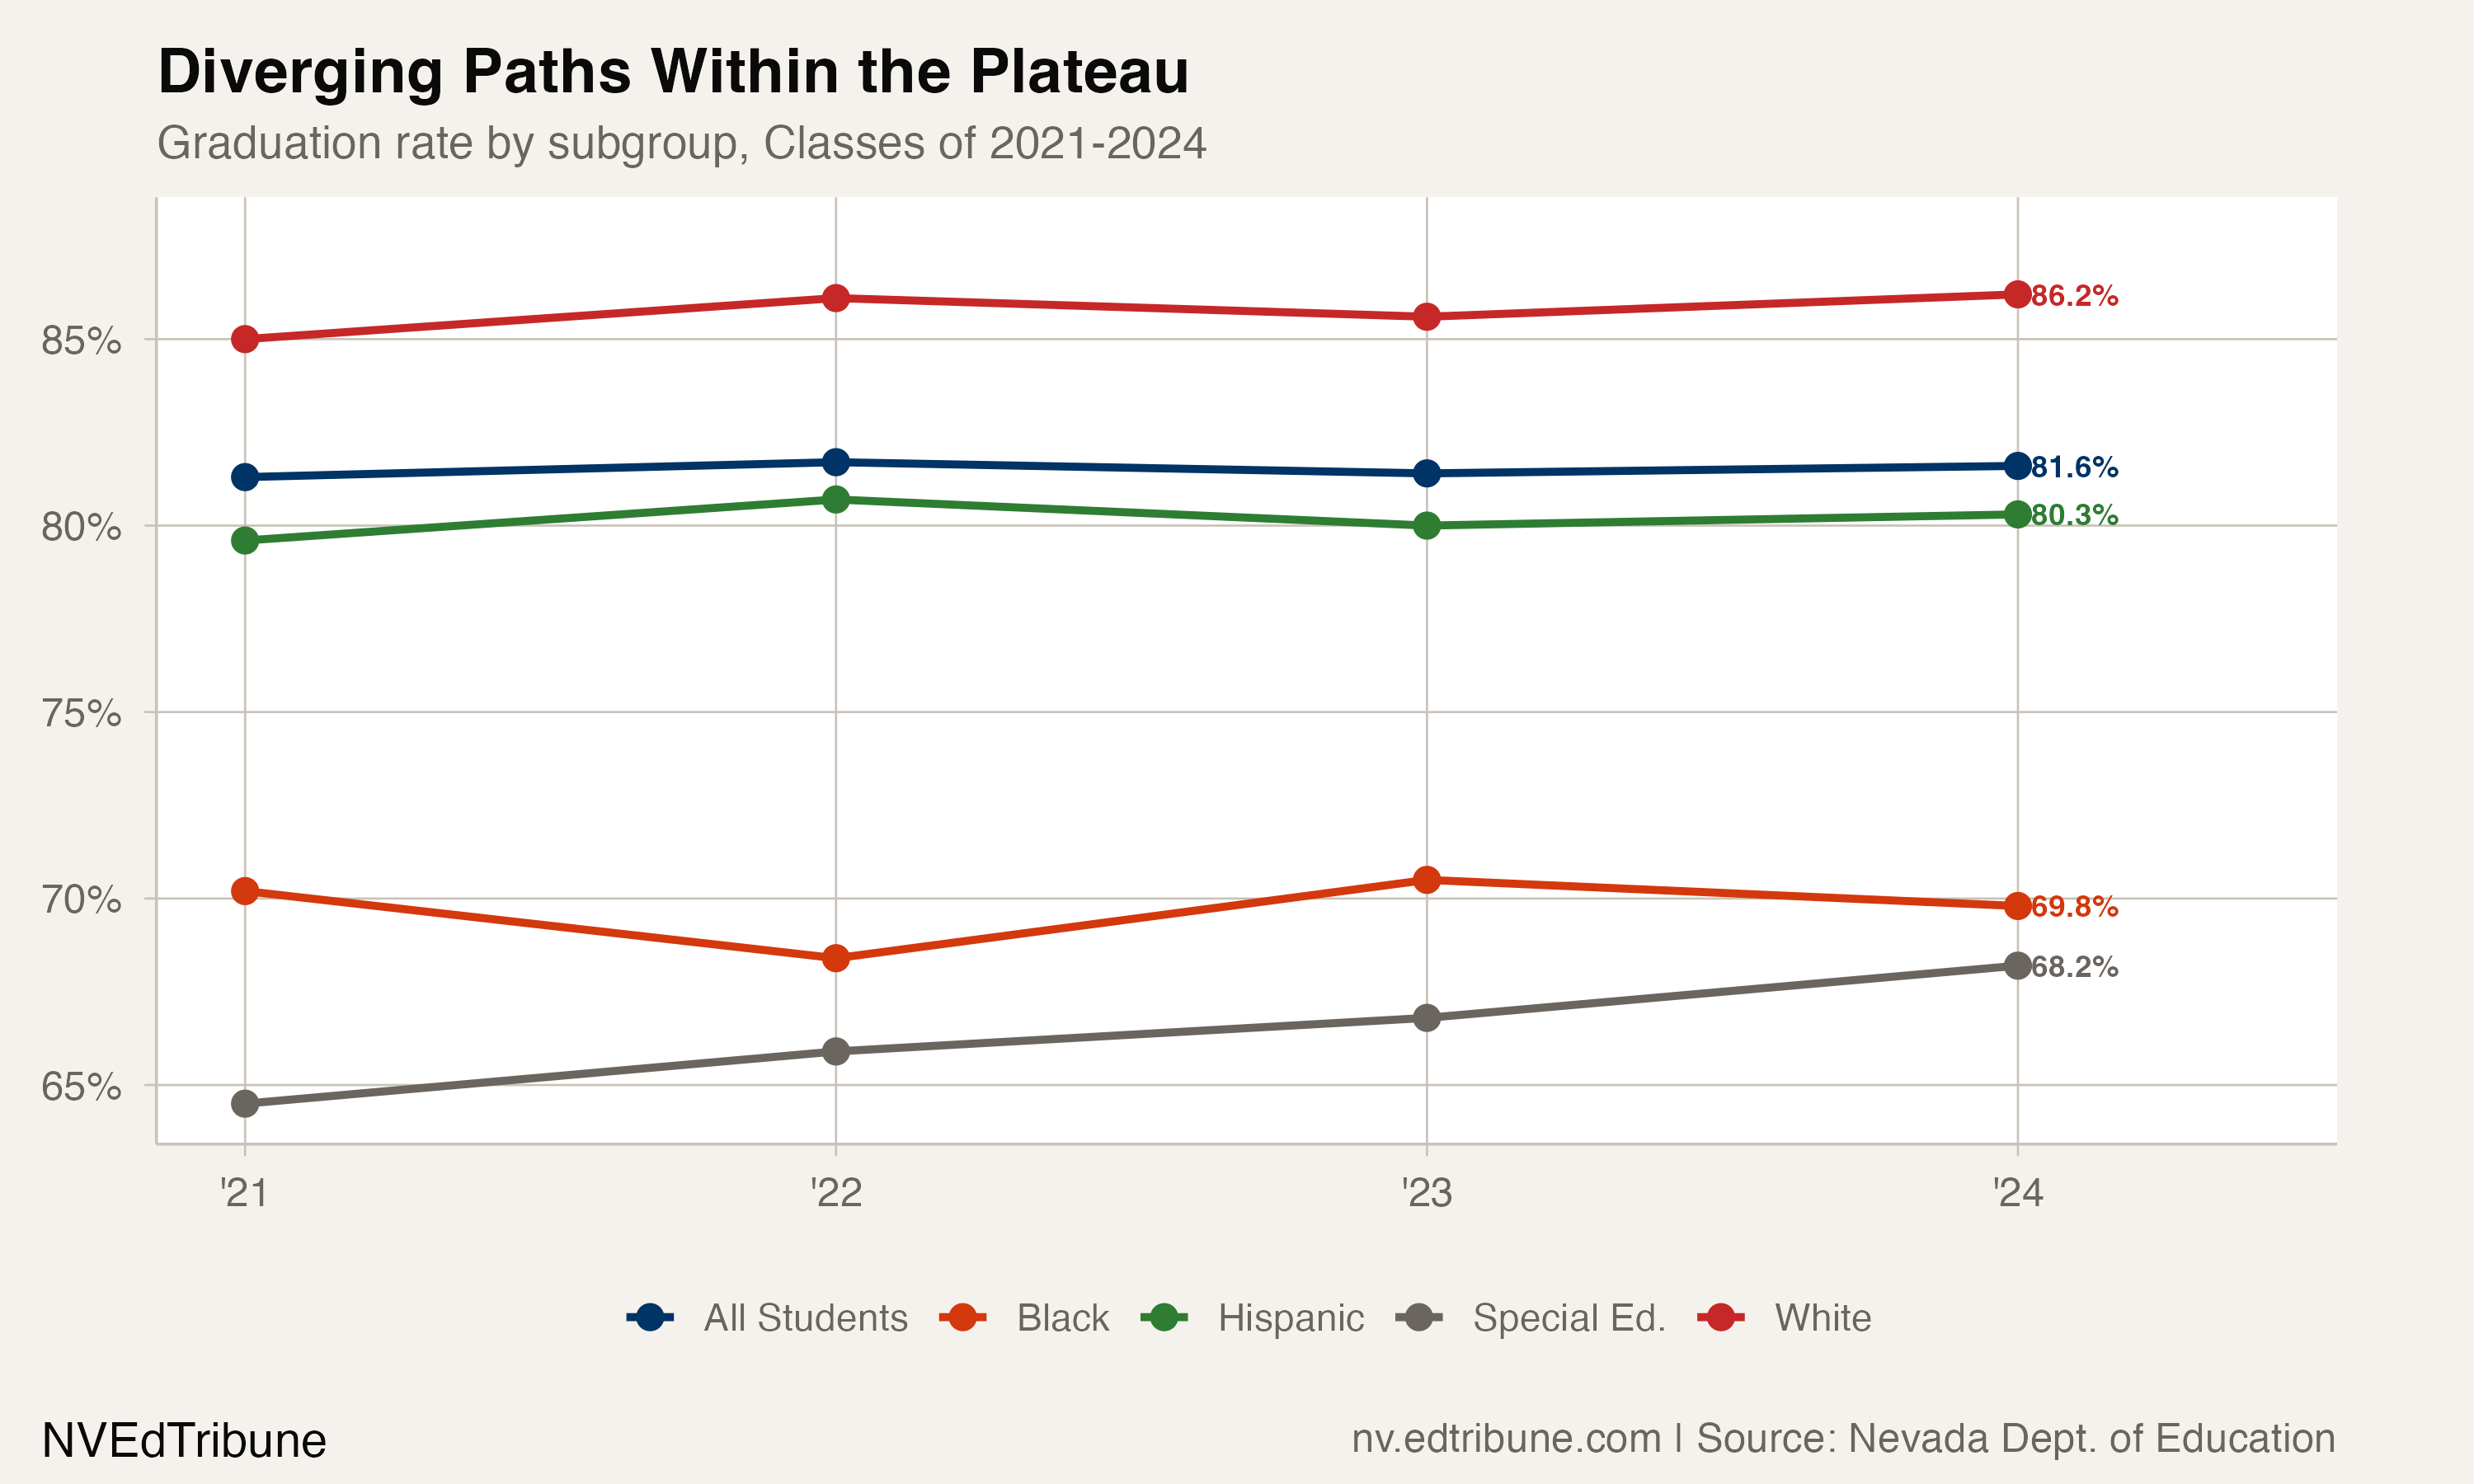
Beneath the surface-level calm, two populations moved in opposite directions. Students with disabilities gained 3.7 percentage points statewide, climbing from 64.5% to 68.2%. Economically disadvantaged students rose 2.2 points. Both gains are real, though they arrived differently: the special education rate climbed in each of the four years, while the economically disadvantaged rate jumped in 2022 and has edged down since.
Black students moved the other way. Their statewide rate dipped from 70.2% in 2021 to 69.8% in 2024. Students identifying with two or more races slipped further, from 83.4% to 82.0%. White, Hispanic, Asian and Native American students all held steady or improved across the same four cohorts.
The gap that matters most
Nevada offers six diploma types, including standard, advanced, and adjusted (IEP) diplomas. The state's four-year rate counts all of them. Even with that broad net, the rate has not cracked 82% in any of the four cohorts in the state's published data. Before the pandemic, Nevada reached 84.1% with the Class of 2019, its modern peak. The flatline that followed means Nevada didn't just fail to recover lost ground. It settled into a new, lower equilibrium and stayed there.
A 5.4-point gap to the national average, applied across a state graduating roughly 30,000 students per year, suggests more than a thousand additional diplomas per cohort would result if Nevada simply matched the country.
Inside the two districts that set the ceiling
Clark County's 81.5% rate in 2024 masks sharp internal variation. White students graduated at 86.0%, while Black students graduated at 71.7%, a 14.3-point gap that did not meaningfully narrow over four years. Clark's special education rate did improve steadily, from 65.5% to 68.7%, tracking the statewide pattern. But the district's Hispanic graduation rate, critical in a county where Hispanic students make up the largest demographic group, oscillated between 79.2% and 80.6% without establishing a trend.
Washoe County↗ET tells a more troubling story. Its economically disadvantaged graduation rate fell from 82.1% in 2021 to 74.5% in 2024, a 7.6-point decline. That erosion happened while Washoe's overall rate barely moved, which means the district's average was being propped up by its more affluent students. A 7.6-point drop in the population most sensitive to school support systems is not a statistical wobble. It suggests something structural changed in how Washoe serves its lowest-income students.
The rural districts nobody sees
The statewide number obscures a genuine success story in rural Nevada. Lander County's leap from 66.7% to 90.7% is the largest four-year gain in the state. White Pine climbed from 83.8% to 91.2%. Douglas rose from 84.5% to 88.1%. Nye, a sprawling desert county stretching from Tonopah to Pahrump, jumped from 83.1% to 86.1%.
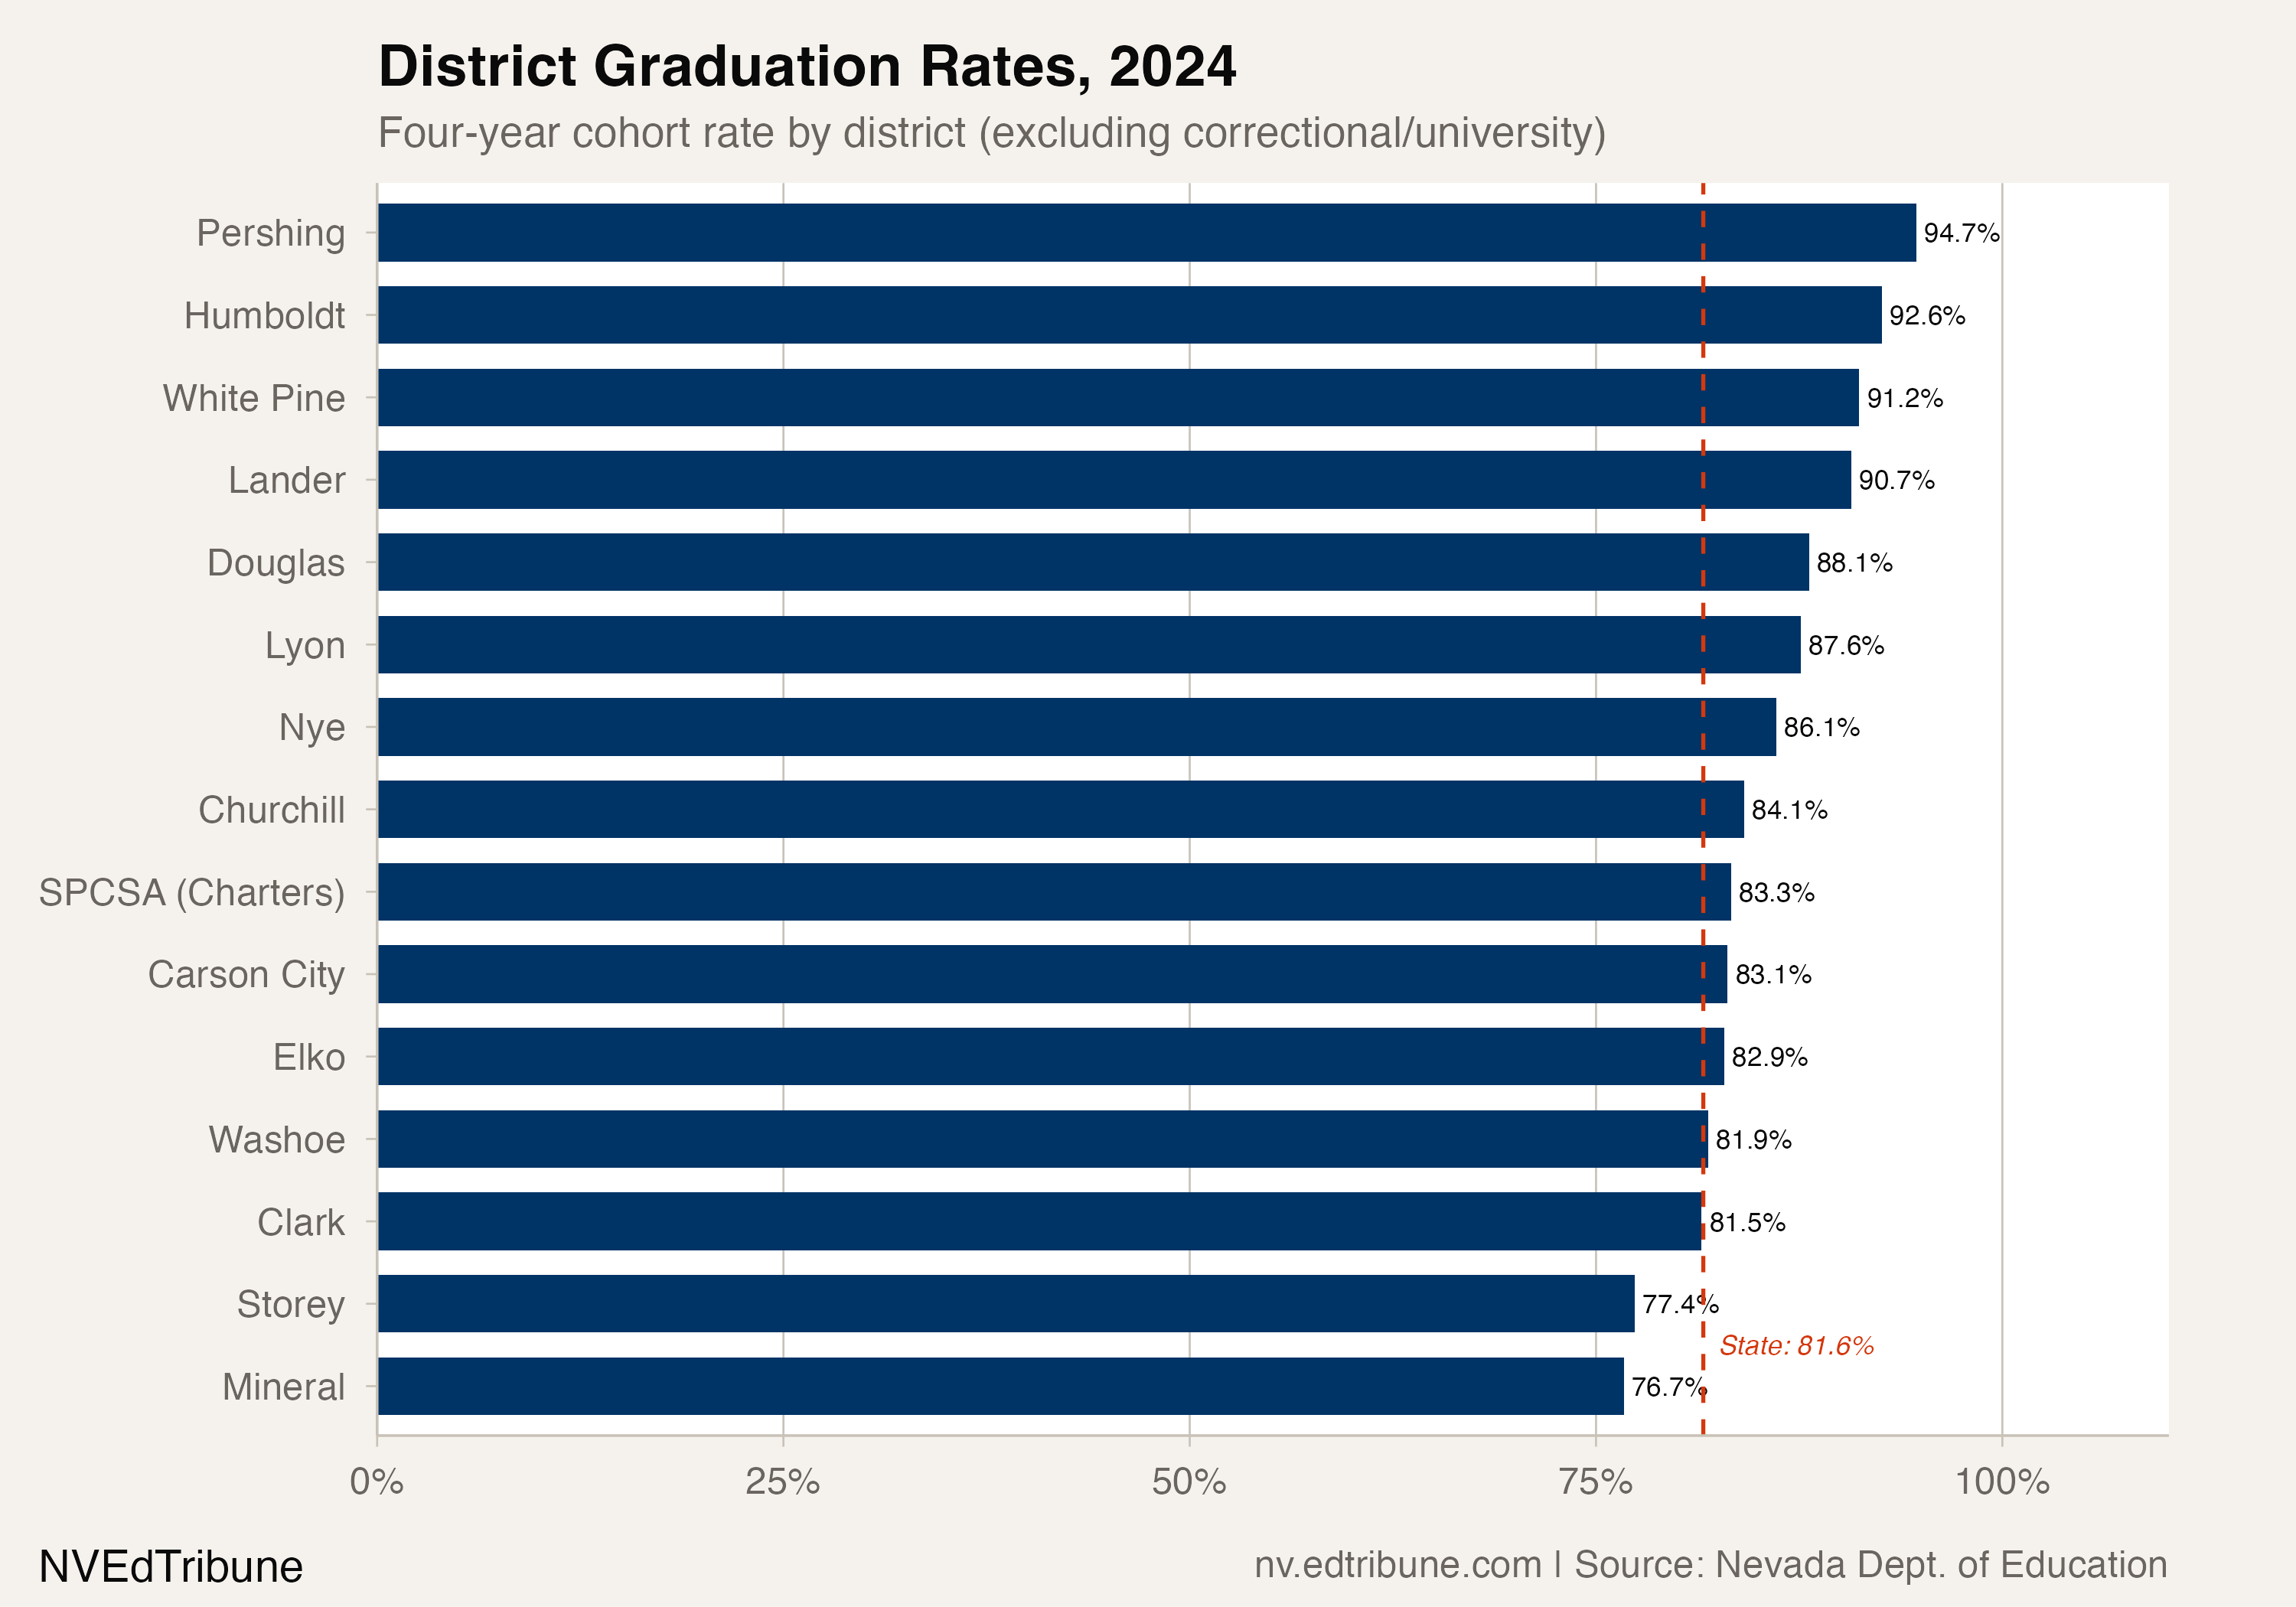
But these districts collectively enroll a tiny fraction of Nevada's students. Even if every rural county in the state achieved a 100% graduation rate, the statewide number would move by a point or two. The arithmetic is merciless: Clark's flatline dominates the average.
Mineral County illustrates the other side of rural volatility. It dropped from 88.9% to 76.7% over four years, the steepest decline in the state. In small districts, one or two students making different choices can swing the rate by double digits. Mineral's graduating classes are small enough that the percentage becomes almost meaningless as a measure of system performance.
The charter sector's quiet slide
SPCSA, the state's charter school authority, graduated 86.9% of its students in 2021, nearly six points above the state average. By 2024, that rate had fallen to 83.3%, a 3.6-point decline. The charter sector still outperforms the state overall, but the gap narrowed from 5.6 points to 1.7 points over four years.
The decline was not uniform across student groups. SPCSA's white graduation rate actually ticked up, from 90.5% to 91.5%. But its Black rate fell from 79.8% to 71.6%, an 8.2-point drop, and its Hispanic rate fell from 83.2% to 78.4%. The charter sector's growing enrollment has been shifting toward greater demographic diversity, and its graduation rates for students of color have not kept pace.
What might break the plateau
The data in this analysis covers the Classes of 2021 through 2024. Preliminary reporting from the Nevada Department of Education indicates the Class of 2025 exceeded Nevada's four-year plateau, which would be the state's highest rate on record, surpassing the pre-pandemic peak. Clark County reportedly rose sharply in a single year.
If those numbers hold, the four-year plateau documented here becomes prologue to a breakout rather than a permanent condition. But a single-year spike in graduation rates is not always what it appears. States have historically seen jumps from policy changes, credit recovery expansions, and diploma pathway adjustments, not all of which represent genuine learning gains. Until the Class of 2025 data is available in the state's published data files, the claimed gains remain preliminary.
The cohort data also cannot answer the most urgent question for Nevada families: whether the students who do graduate are prepared for what comes next. Nevada's college-going rate has been declining even as the high school completion rate has held steady, a pattern that suggests the diploma itself may be a less reliable signal of readiness than it once was.
For four years, Nevada's graduation rate traced a flat line five points below the national average while gains for students with disabilities and losses for Black and multiracial students offset each other in the aggregate. One breakout year does not erase four years of stagnation. When the Class of 2026 rate is published, it will show whether that preliminary result was a turning point or a blip.
Detailed code that reproduces the analysis and figures in this article is available exclusively to EdTribune subscribers.
Discussion
Sign in to join the discussion.
Loading comments...