Clark County↗ET’s four-year graduation rate rose to 86.6% for the Class of 2025, up from 81.5% for the Class of 2024. The increase was 5.1 percentage points.
Clark had reported 81.5% for the Class of 2023 as well. The new result changes the picture of a plateau: compared with the Class of 2021’s 80.9%, the district gained 5.7 points across the observed period.
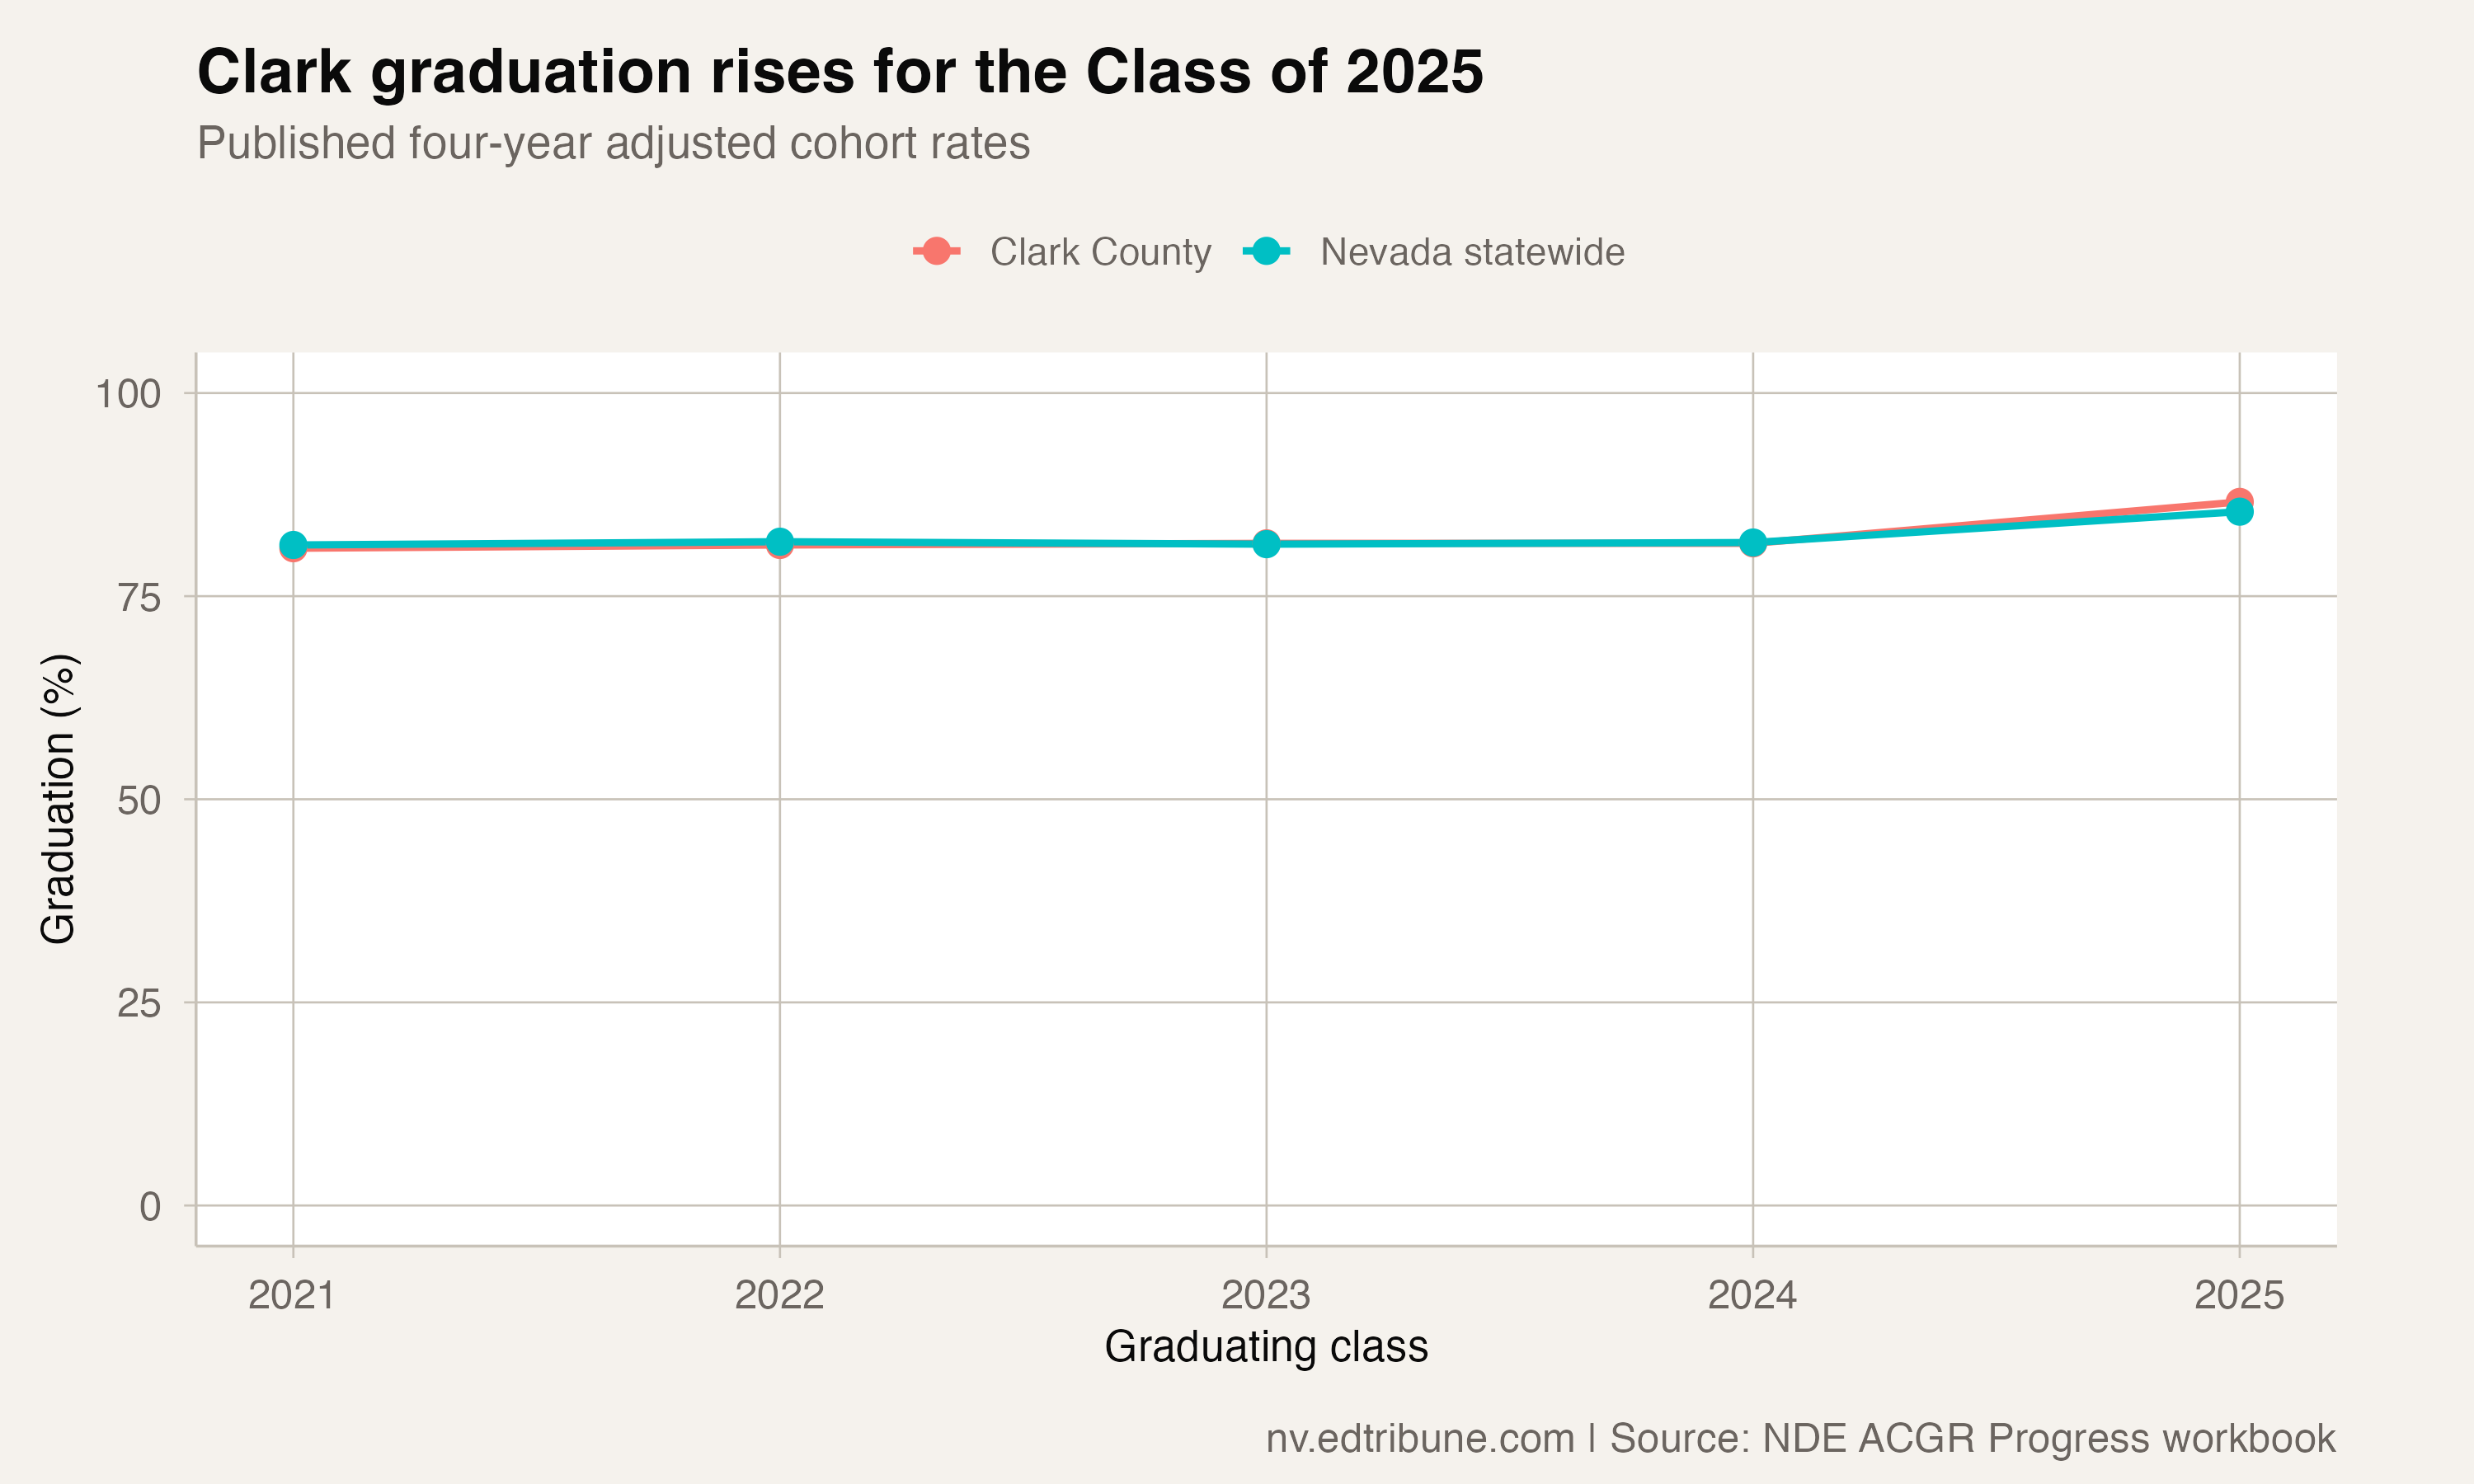
Nevada’s statewide four-year rate was 85.4% for the Class of 2025. Clark’s rate was above the state’s published figure. These are adjusted cohort completion rates; they do not describe a single year’s senior enrollment.
The complement of Clark’s graduation rate was 13.4%. That represents the share of its adjusted cohort outside the four-year graduation measure. It must not be described as a dropout rate: students can have other outcomes, including continued enrollment.
Subgroup results
Clark’s published Class of 2025 rates were 94.1% for Asian students, 88.0% for White students, 86.4% for Hispanic students, 80.6% for Black students and 78.4% for students with disabilities. The White–Black rate difference was 7.4 percentage points.
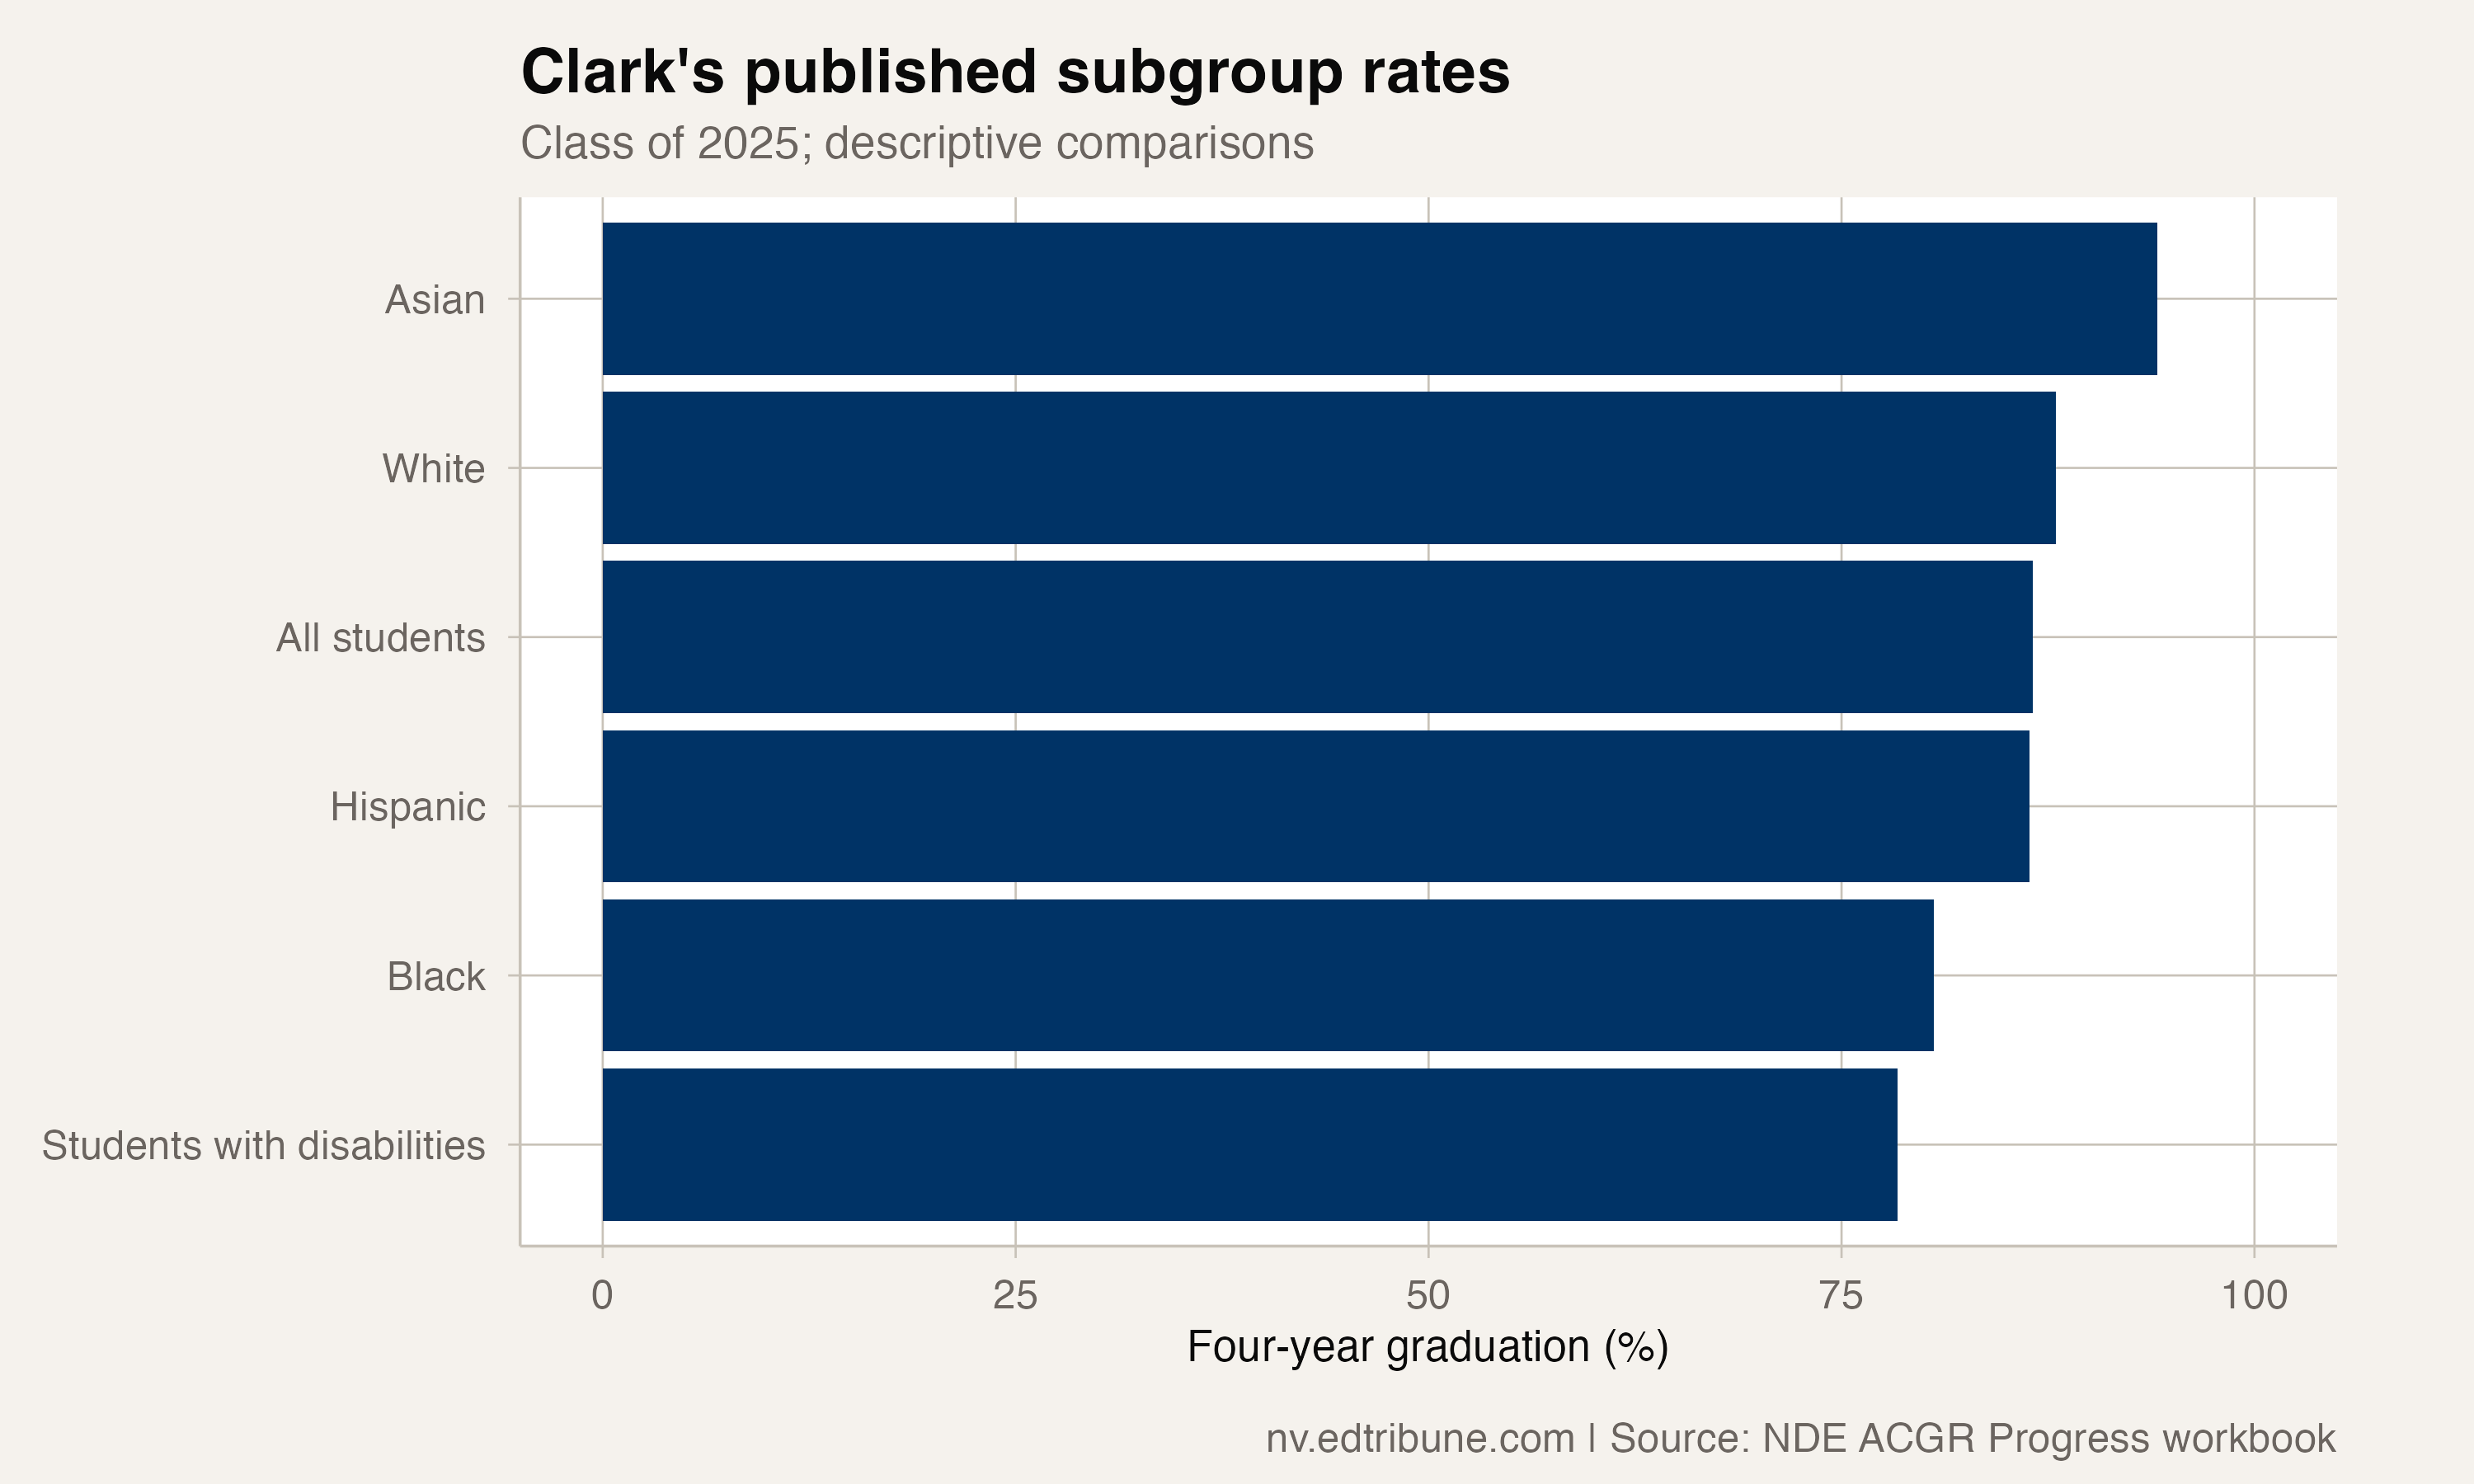
These differences describe outcomes. The rates alone do not establish the effects of particular district programs or provide a demographic adjustment for comparisons.
What the records can establish
The Nevada Department of Education’s official graduation workbook supplies the published rates used here. Its Class of 2024 Native American district records contain contradictory cells under the same reporting identities. This article makes no historical rate claim from those conflicting cells.
The Class of 2025 graduation report independently reports the statewide and Clark results. Its total-cohort headcounts are not substituted for the adjusted denominator, so this article does not estimate graduate counts from the percentages.
Detailed code that reproduces the analysis and figures in this article is available exclusively to EdTribune subscribers.
Discussion
Sign in to join the discussion.
Loading comments...