Nevada students in the state's economic-disadvantage category graduated at 85.1% for the Class of 2025, close to the overall statewide rate of 85.4%. The difference was 0.3 percentage points.
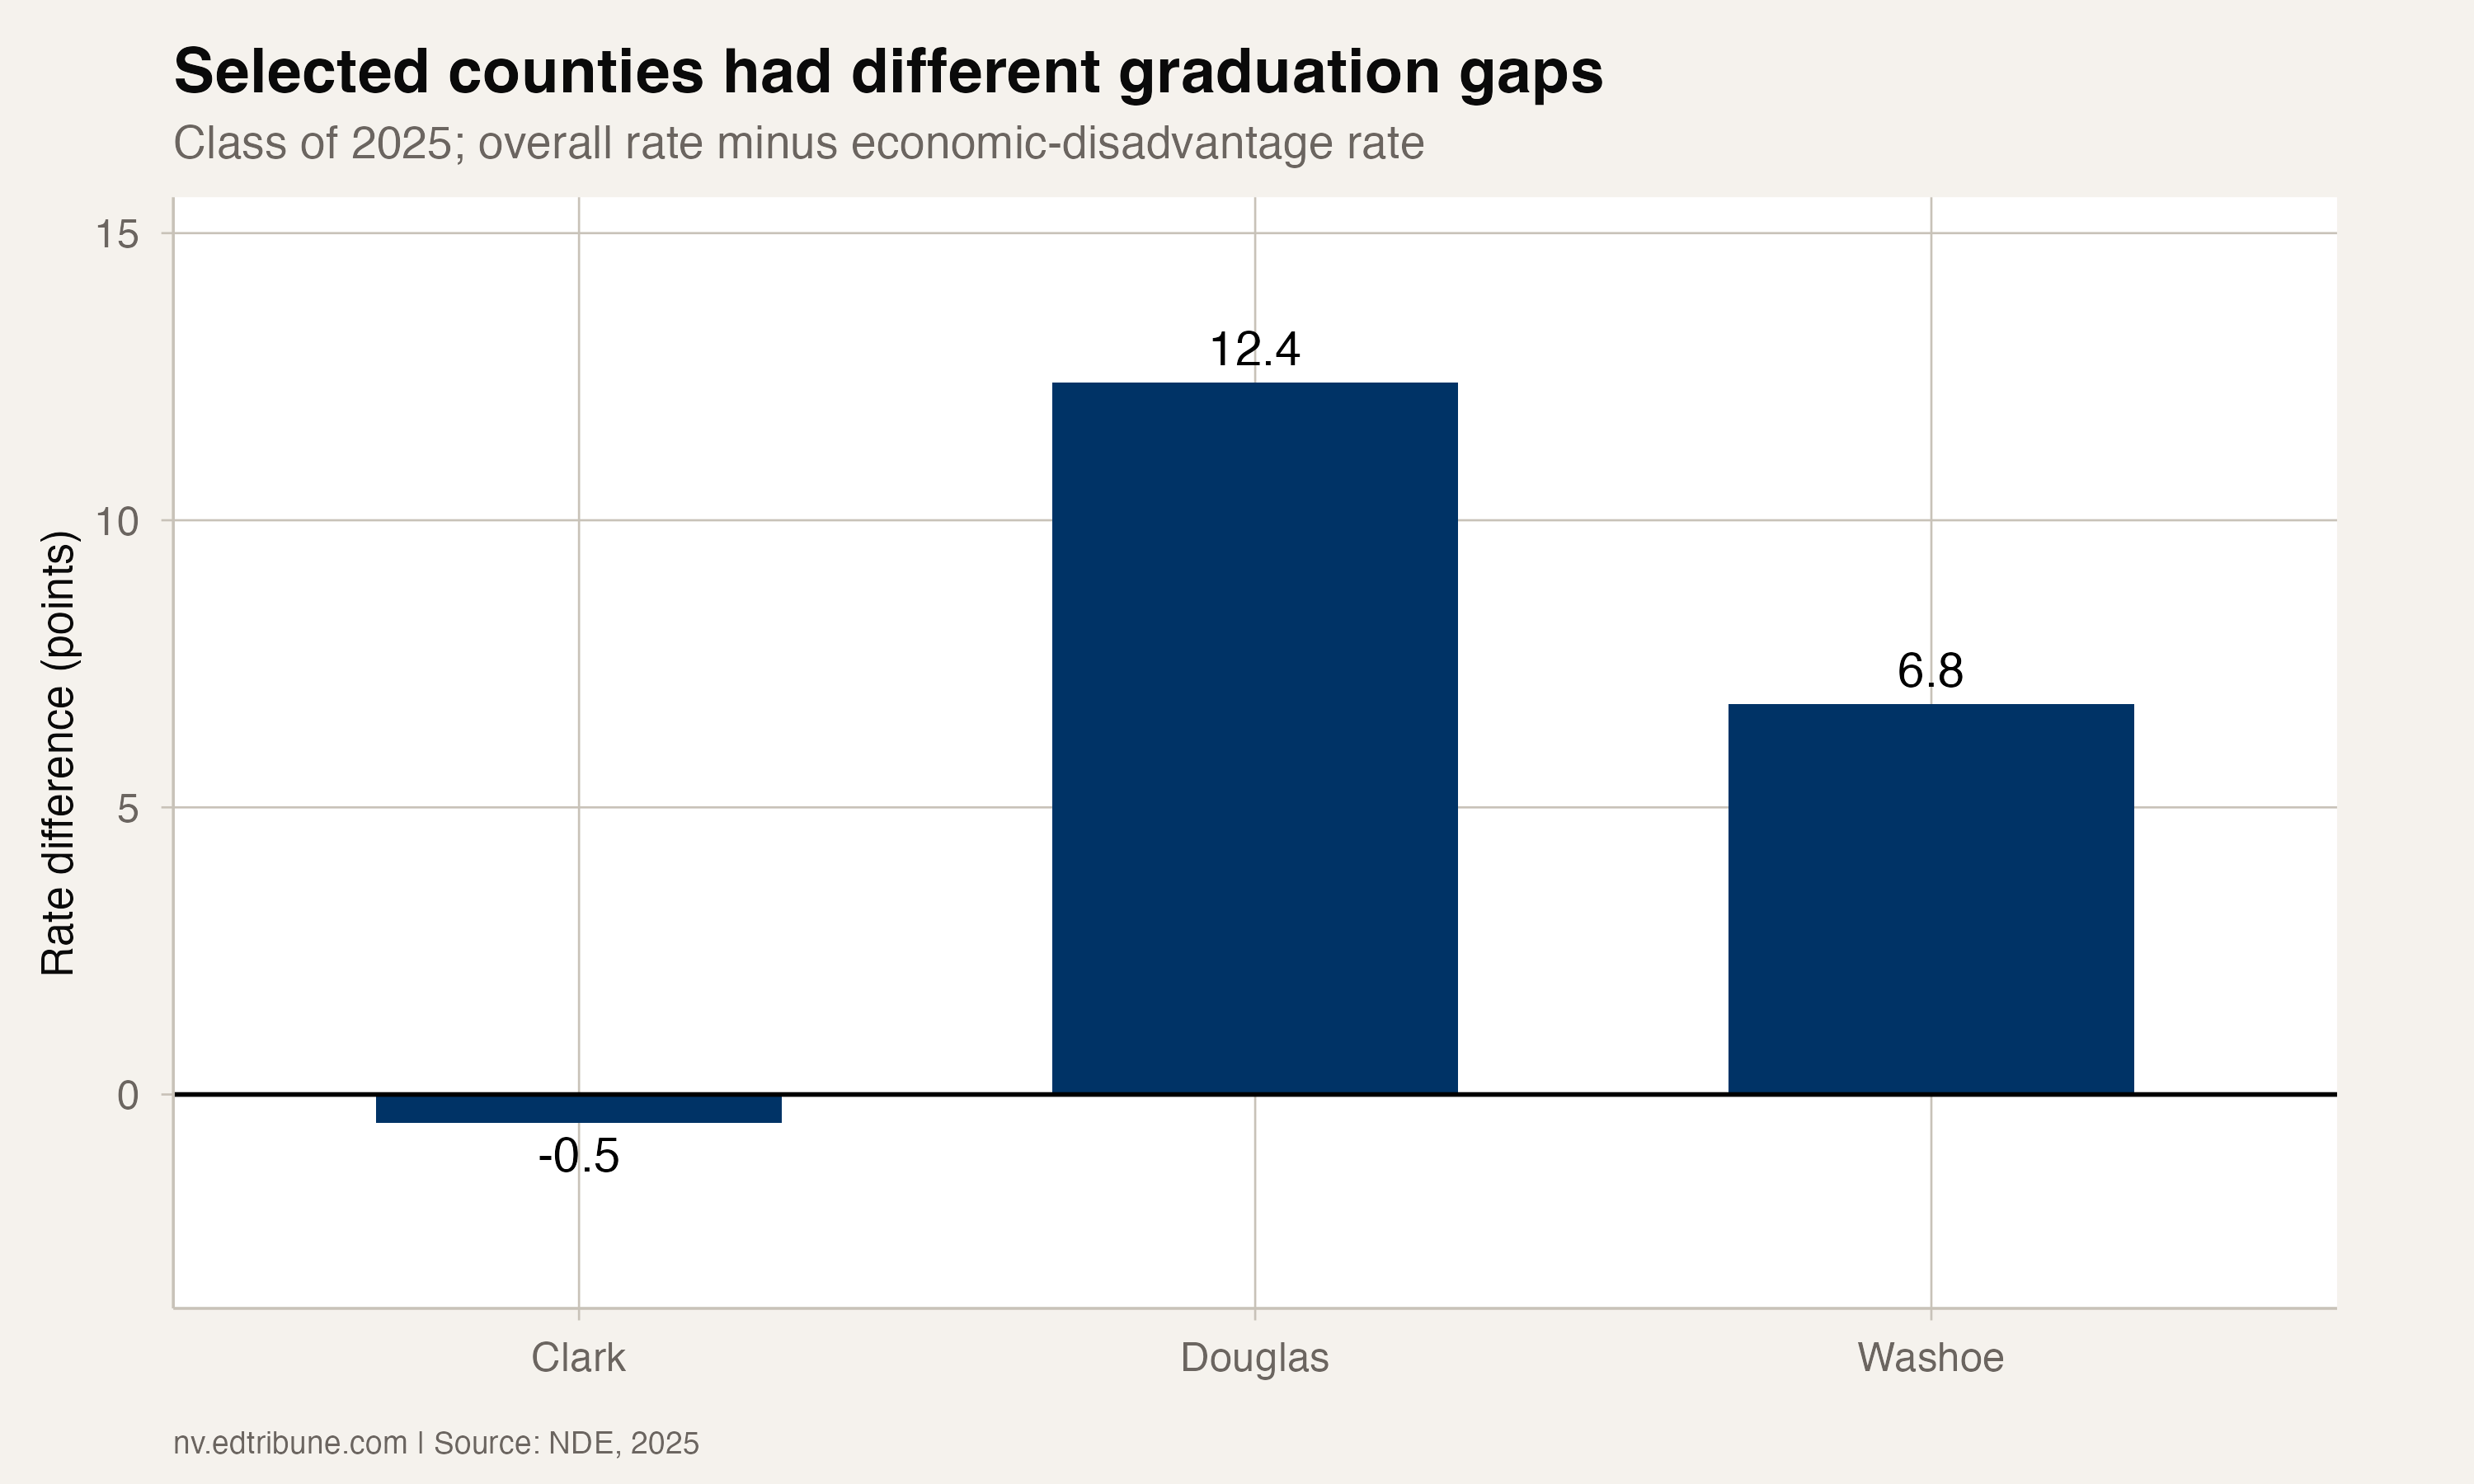
That small statewide difference does not describe every district. In Clark County↗ET, the group's published rate was 87.1%, above the overall rate of 86.6%. In Washoe County↗ET, it was 76.5%, below the overall rate of 83.3%.
Those comparisons use each group's own published graduation rate. Students in the economic-disadvantage category are also part of the all-student population. The difference between those rates is therefore not a direct comparison between students in that category and everyone outside it.
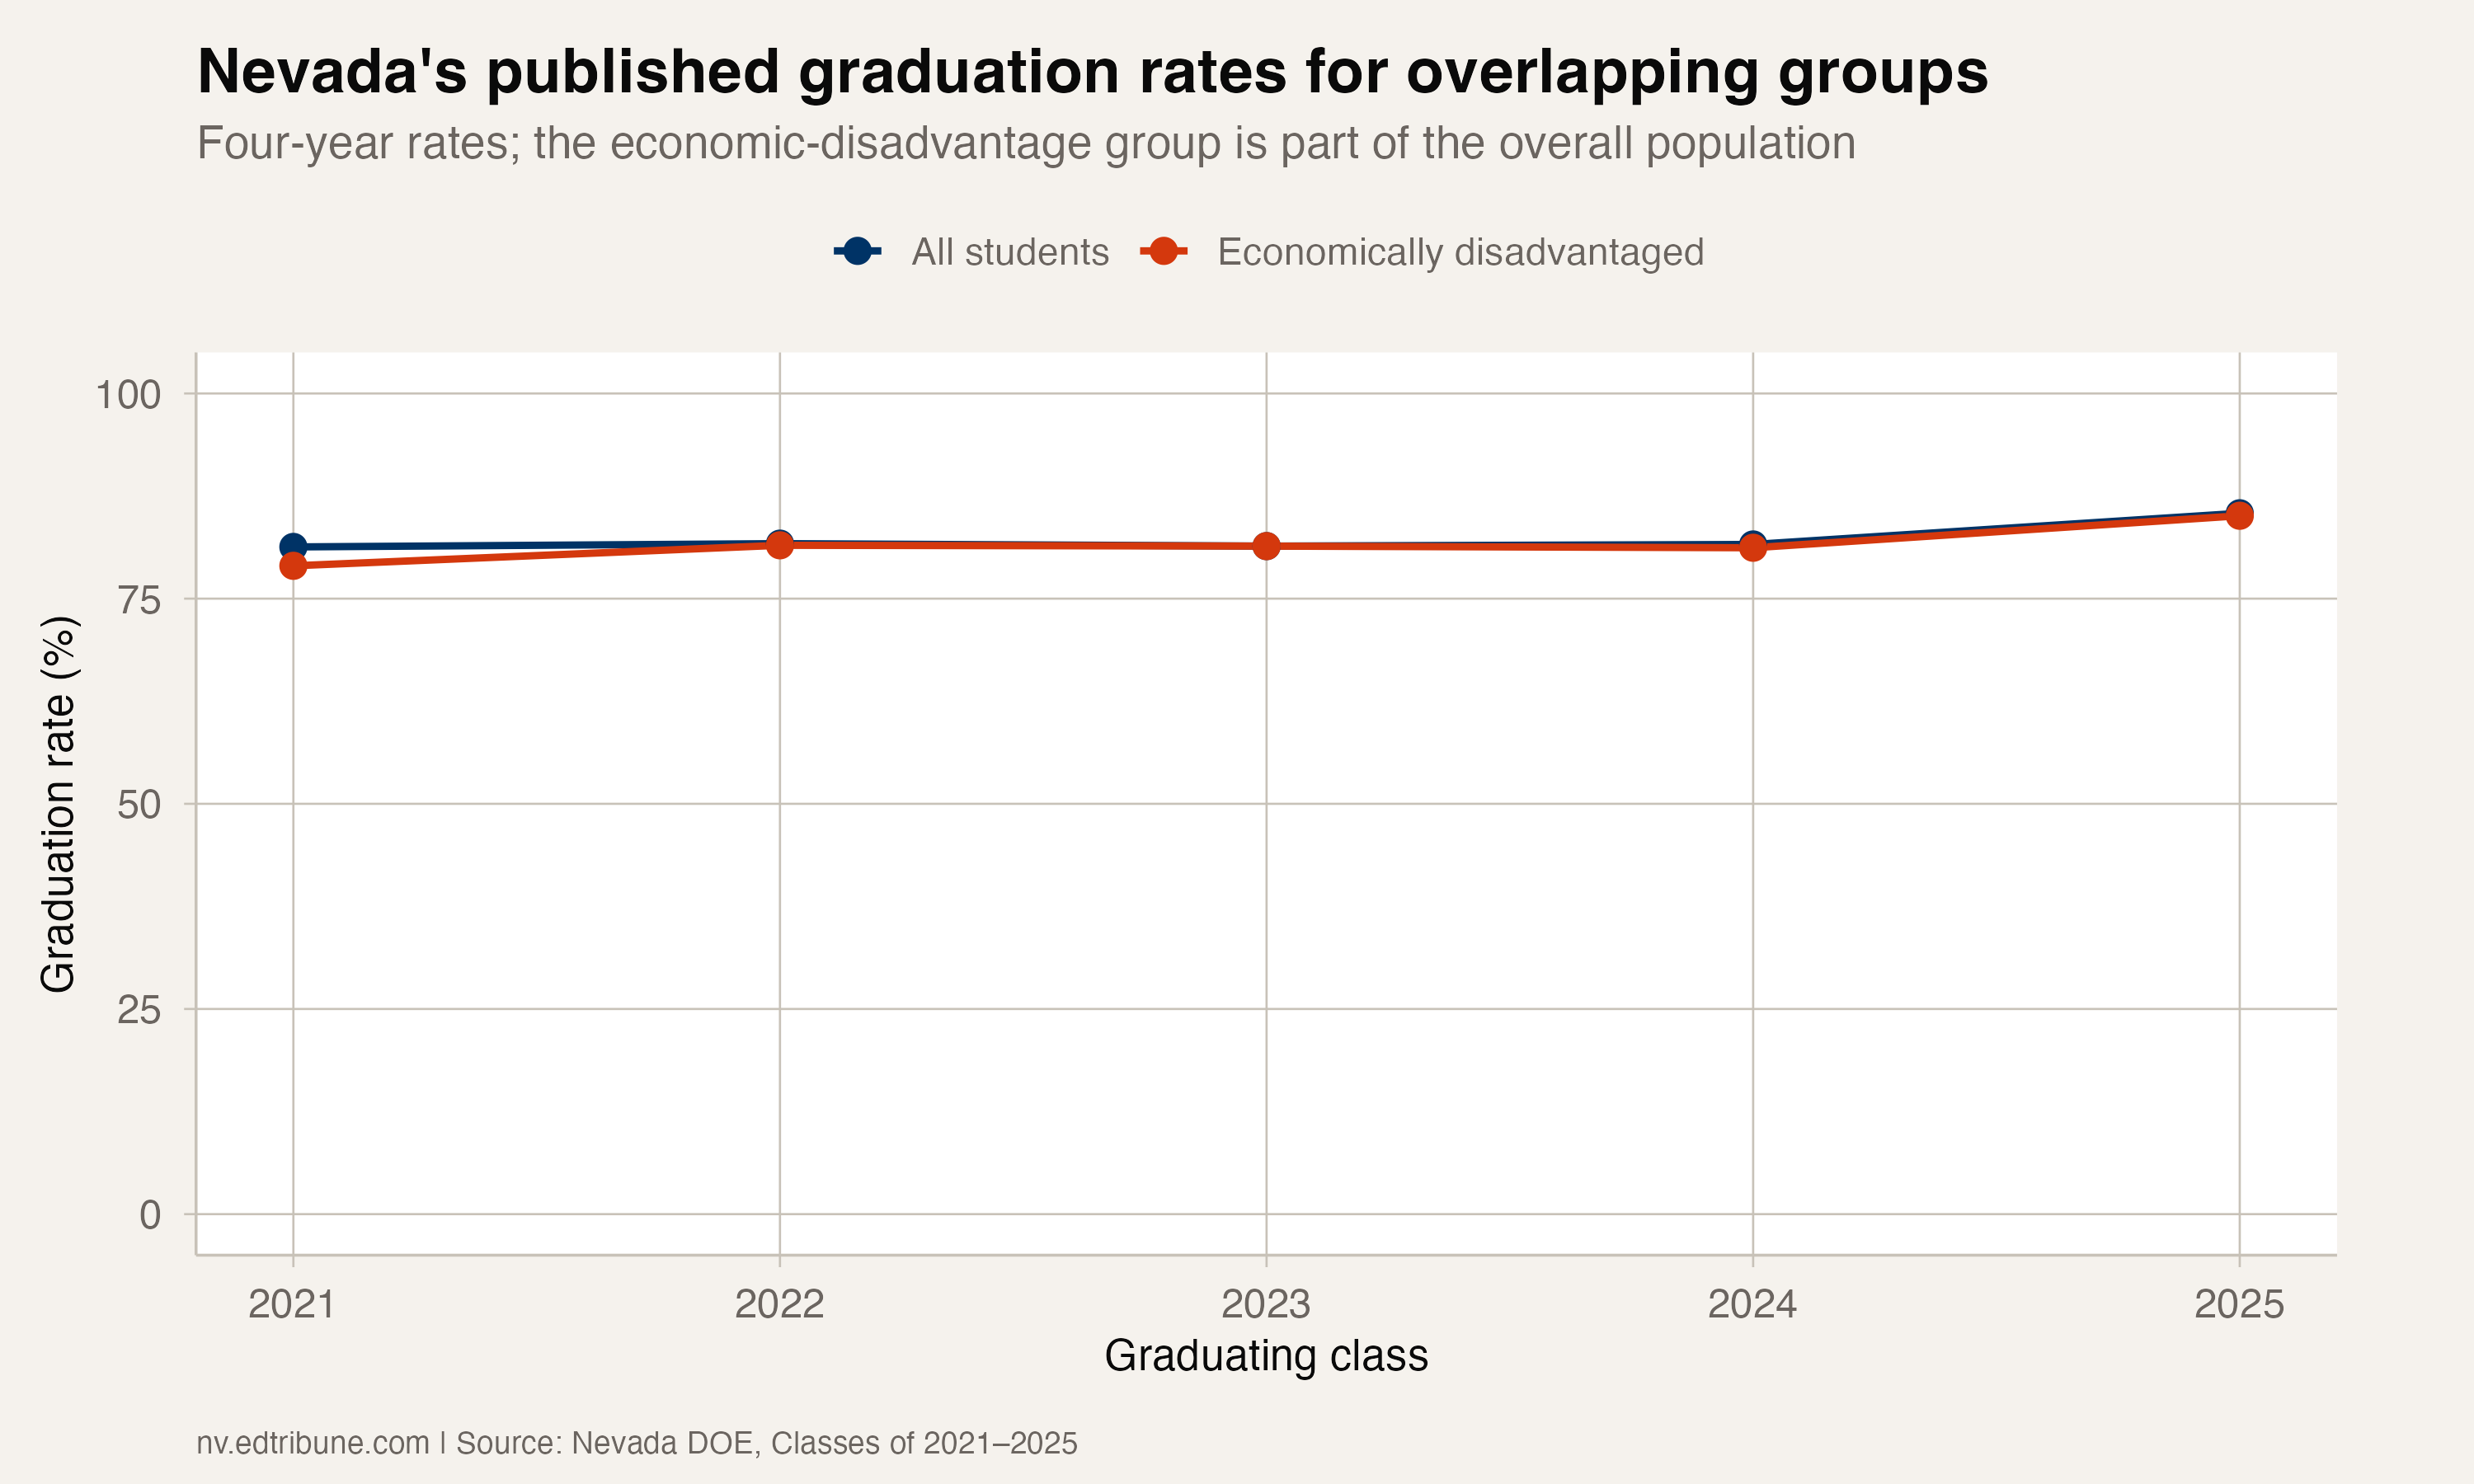
Similar statewide rates across recent classes
The statewide difference was 0.2 points in 2022, zero in 2023 and 0.4 points in 2024. In 2021, it had been 2.3 points. These are differences between separately published rates, rather than estimates from student counts.
For the Class of 2024, the state's overall rate was 81.6%, compared with 81.2% for the economic-disadvantage category. Both rates were higher in the following class. That change does not establish that the same students improved their outcomes: each graduating class is a different cohort.
The small difference tells readers that the two reported rates were close. It cannot, by itself, establish that family income no longer matters, that a classification measures household poverty accurately, or that a particular meal program caused the rates to converge.
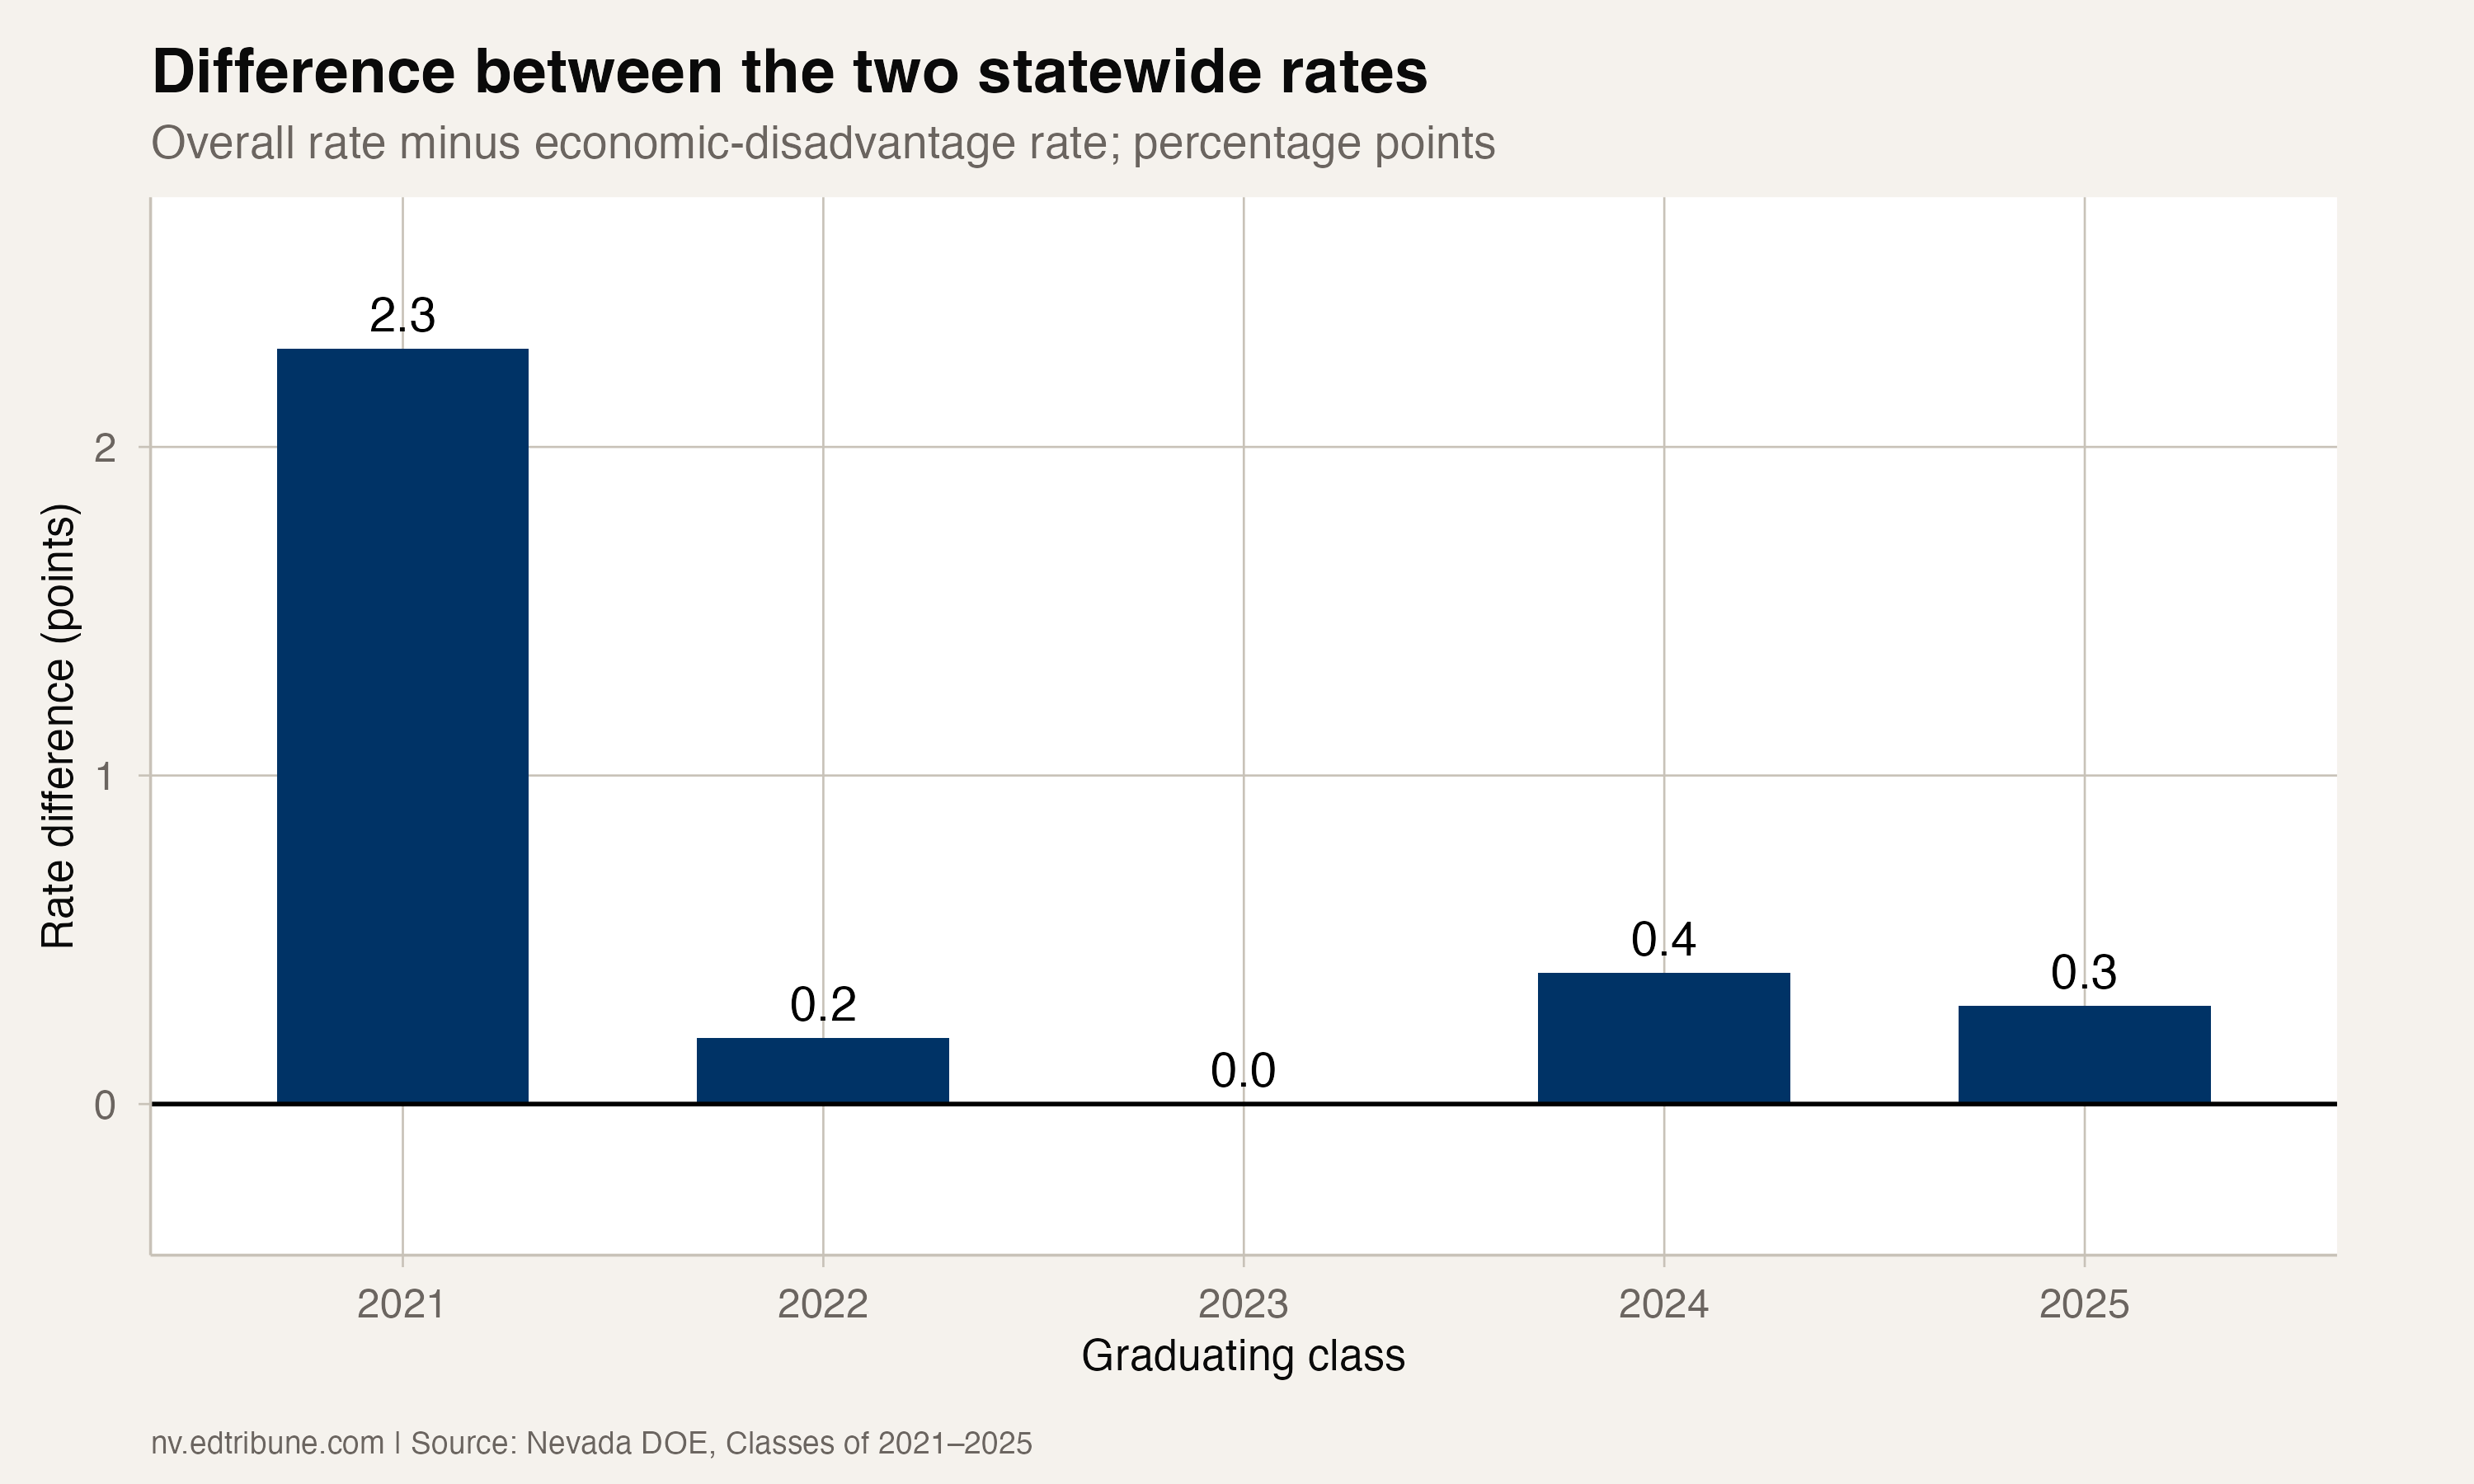
County comparisons show what the statewide result leaves out
For the Class of 2025, Washoe's all-student rate was 6.8 points above its economic-disadvantage rate. Douglas County↗ET had a larger difference in this selected comparison: 12.4 points, from an overall rate of 85.9% and a subgroup rate of 73.5%.
Clark's subgroup rate, meanwhile, was 0.5 points above its overall rate. That is mathematically possible because the subgroup is included in the overall population. It does not show that disadvantage improves a student's prospects or that a district has eliminated barriers to completion.
The statewide total combines populations with different outcomes. A close statewide pair of rates can coexist with a wider difference inside a particular county. These selected counties illustrate the variation; they are not a statewide ranking or a controlled comparison of district performance.
The source is the Nevada Department of Education's Report Card, using its published four-year adjusted cohort graduation rates. The comparison retains the source's student-group classifications. It does not convert a category label into a household-income measure or estimate unreported cohort counts.
For a district reviewing completion support, the statewide near-parity is only a starting point. Washoe and Douglas have visibly different reported outcomes within their own populations. Explaining those differences requires evidence about how students are classified, which students are included and what support they received, rather than an explanation inferred from the proximity of two statewide lines.
Detailed code that reproduces the analysis and figures in this article is available exclusively to EdTribune subscribers.
Discussion
Sign in to join the discussion.
Loading comments...