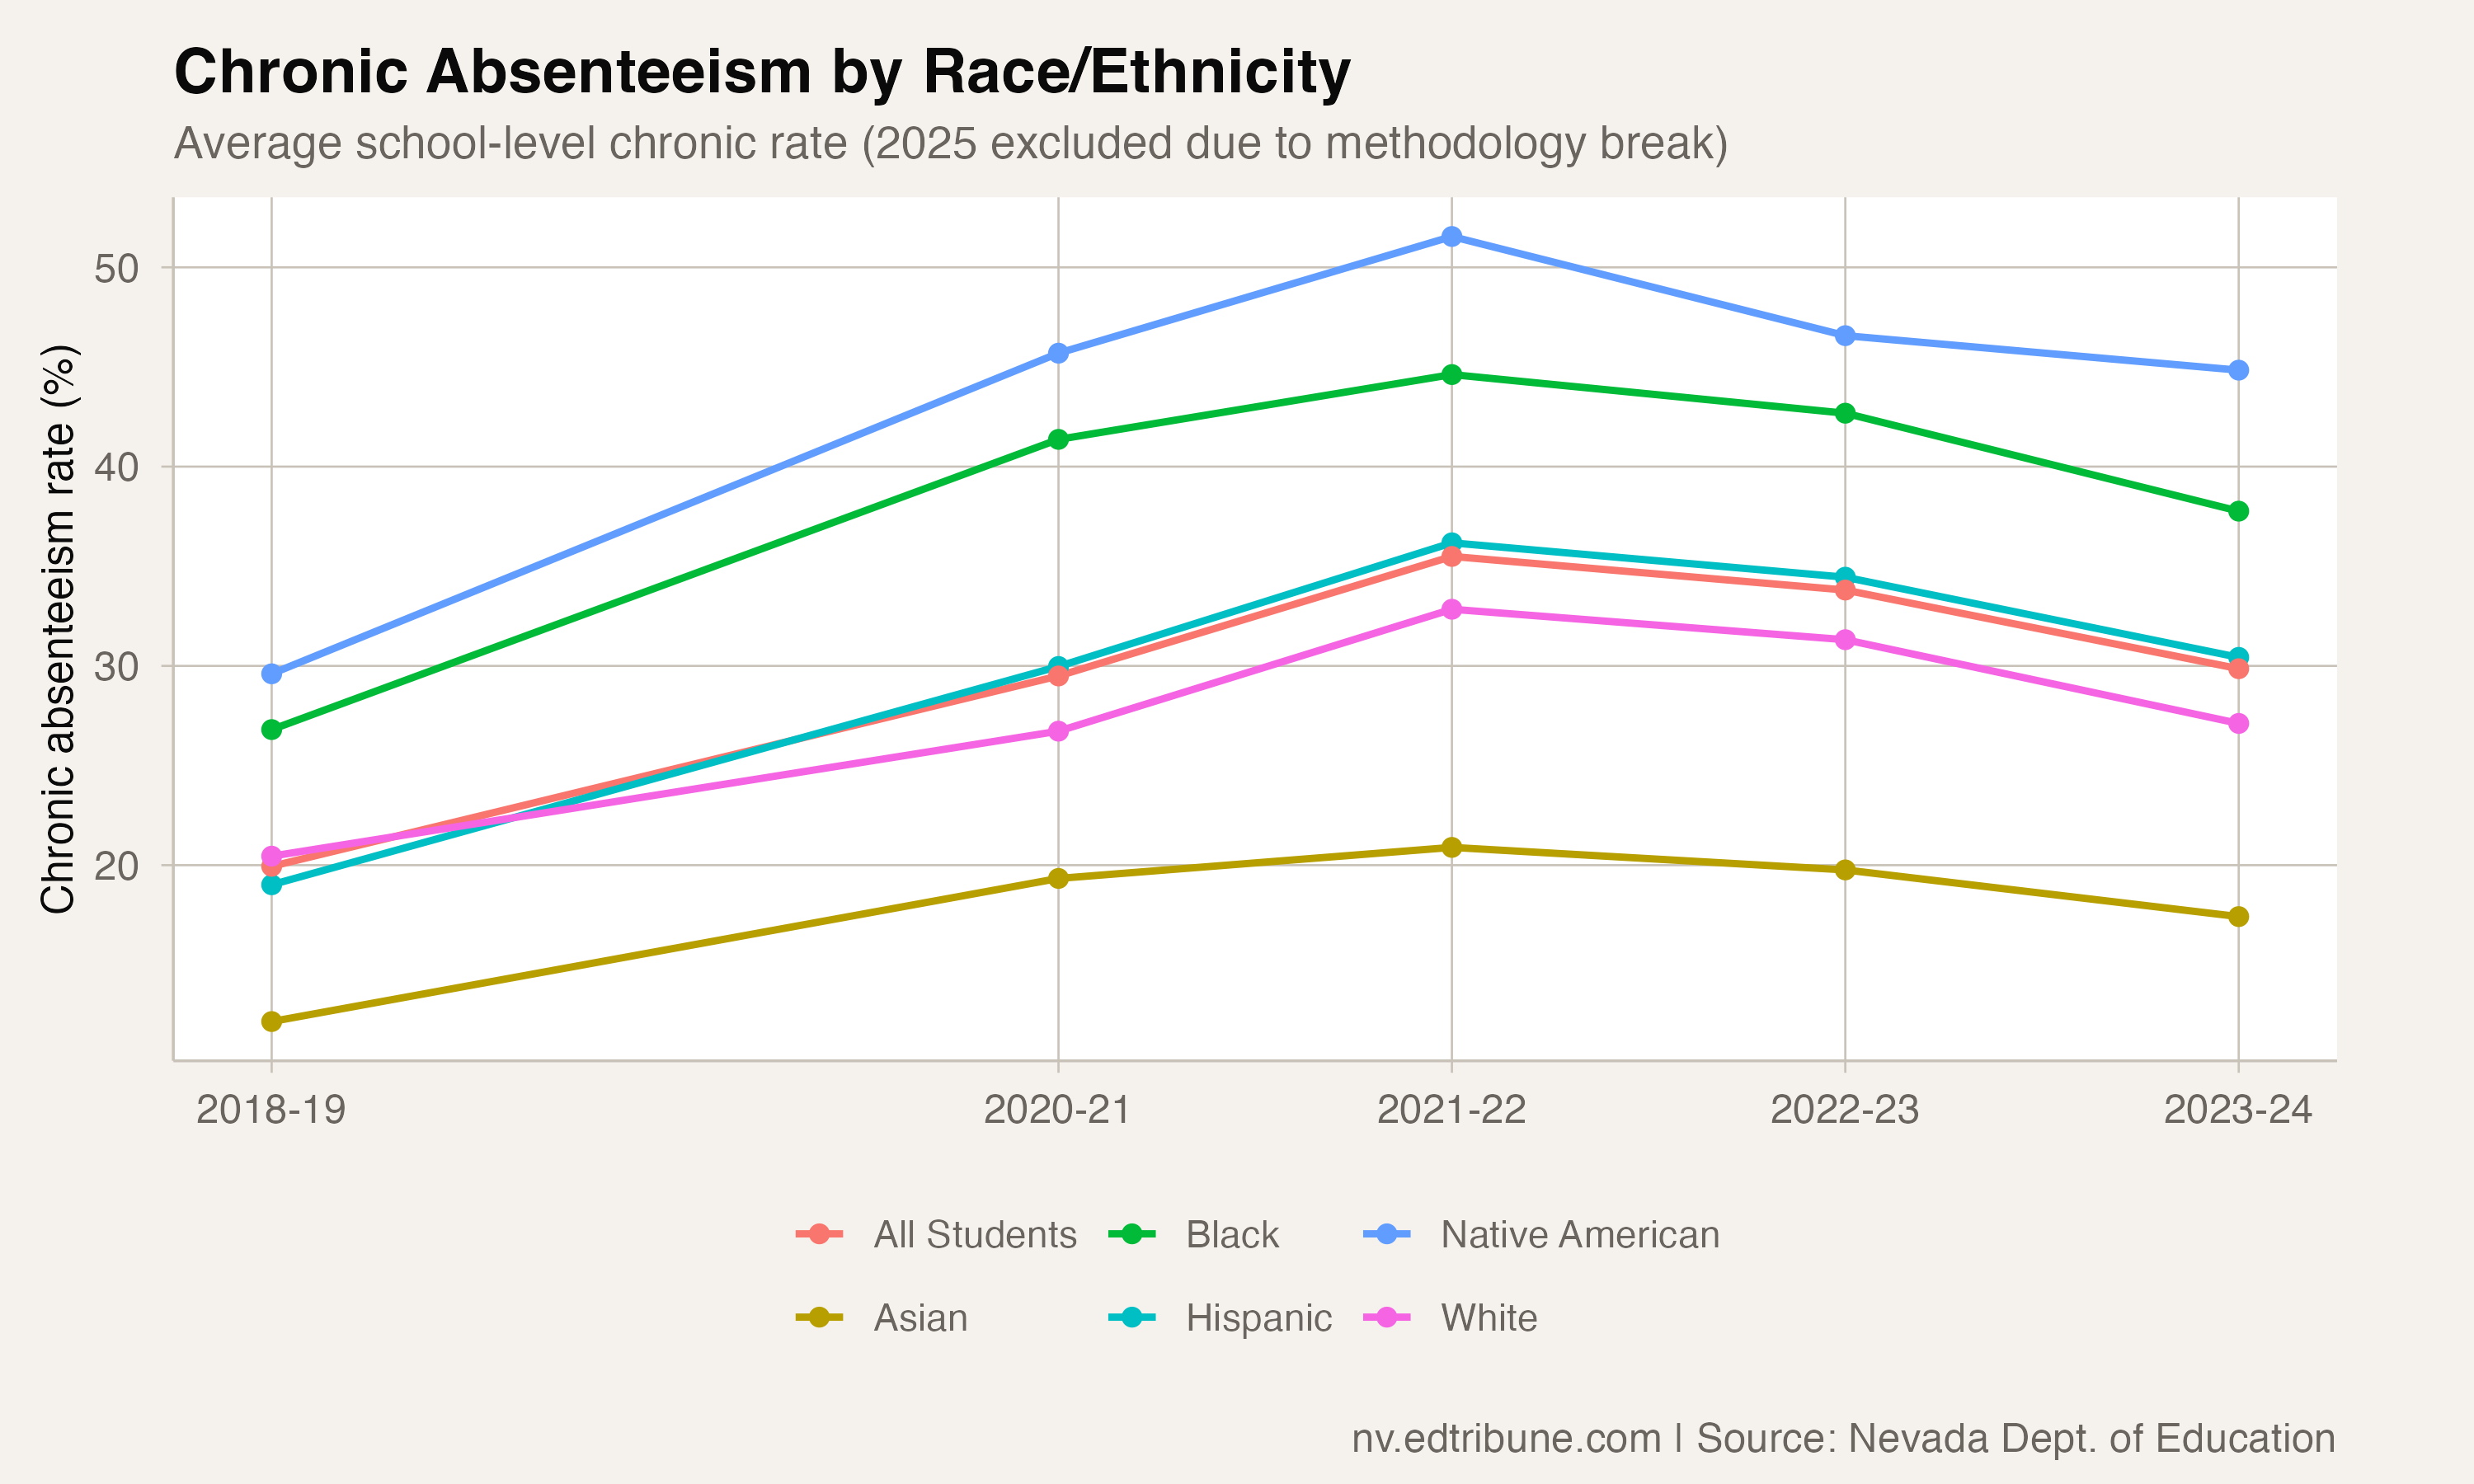
Chronic absenteeism among Native American students in Nevada has improved by about 7 points since its 2021-22 peak, falling from 51.5% to 44.8% in 2023-24 in schools where the subgroup is reported. That two-year improvement roughly matches the recovery seen for Black students and exceeds the gain for white students in raw points.
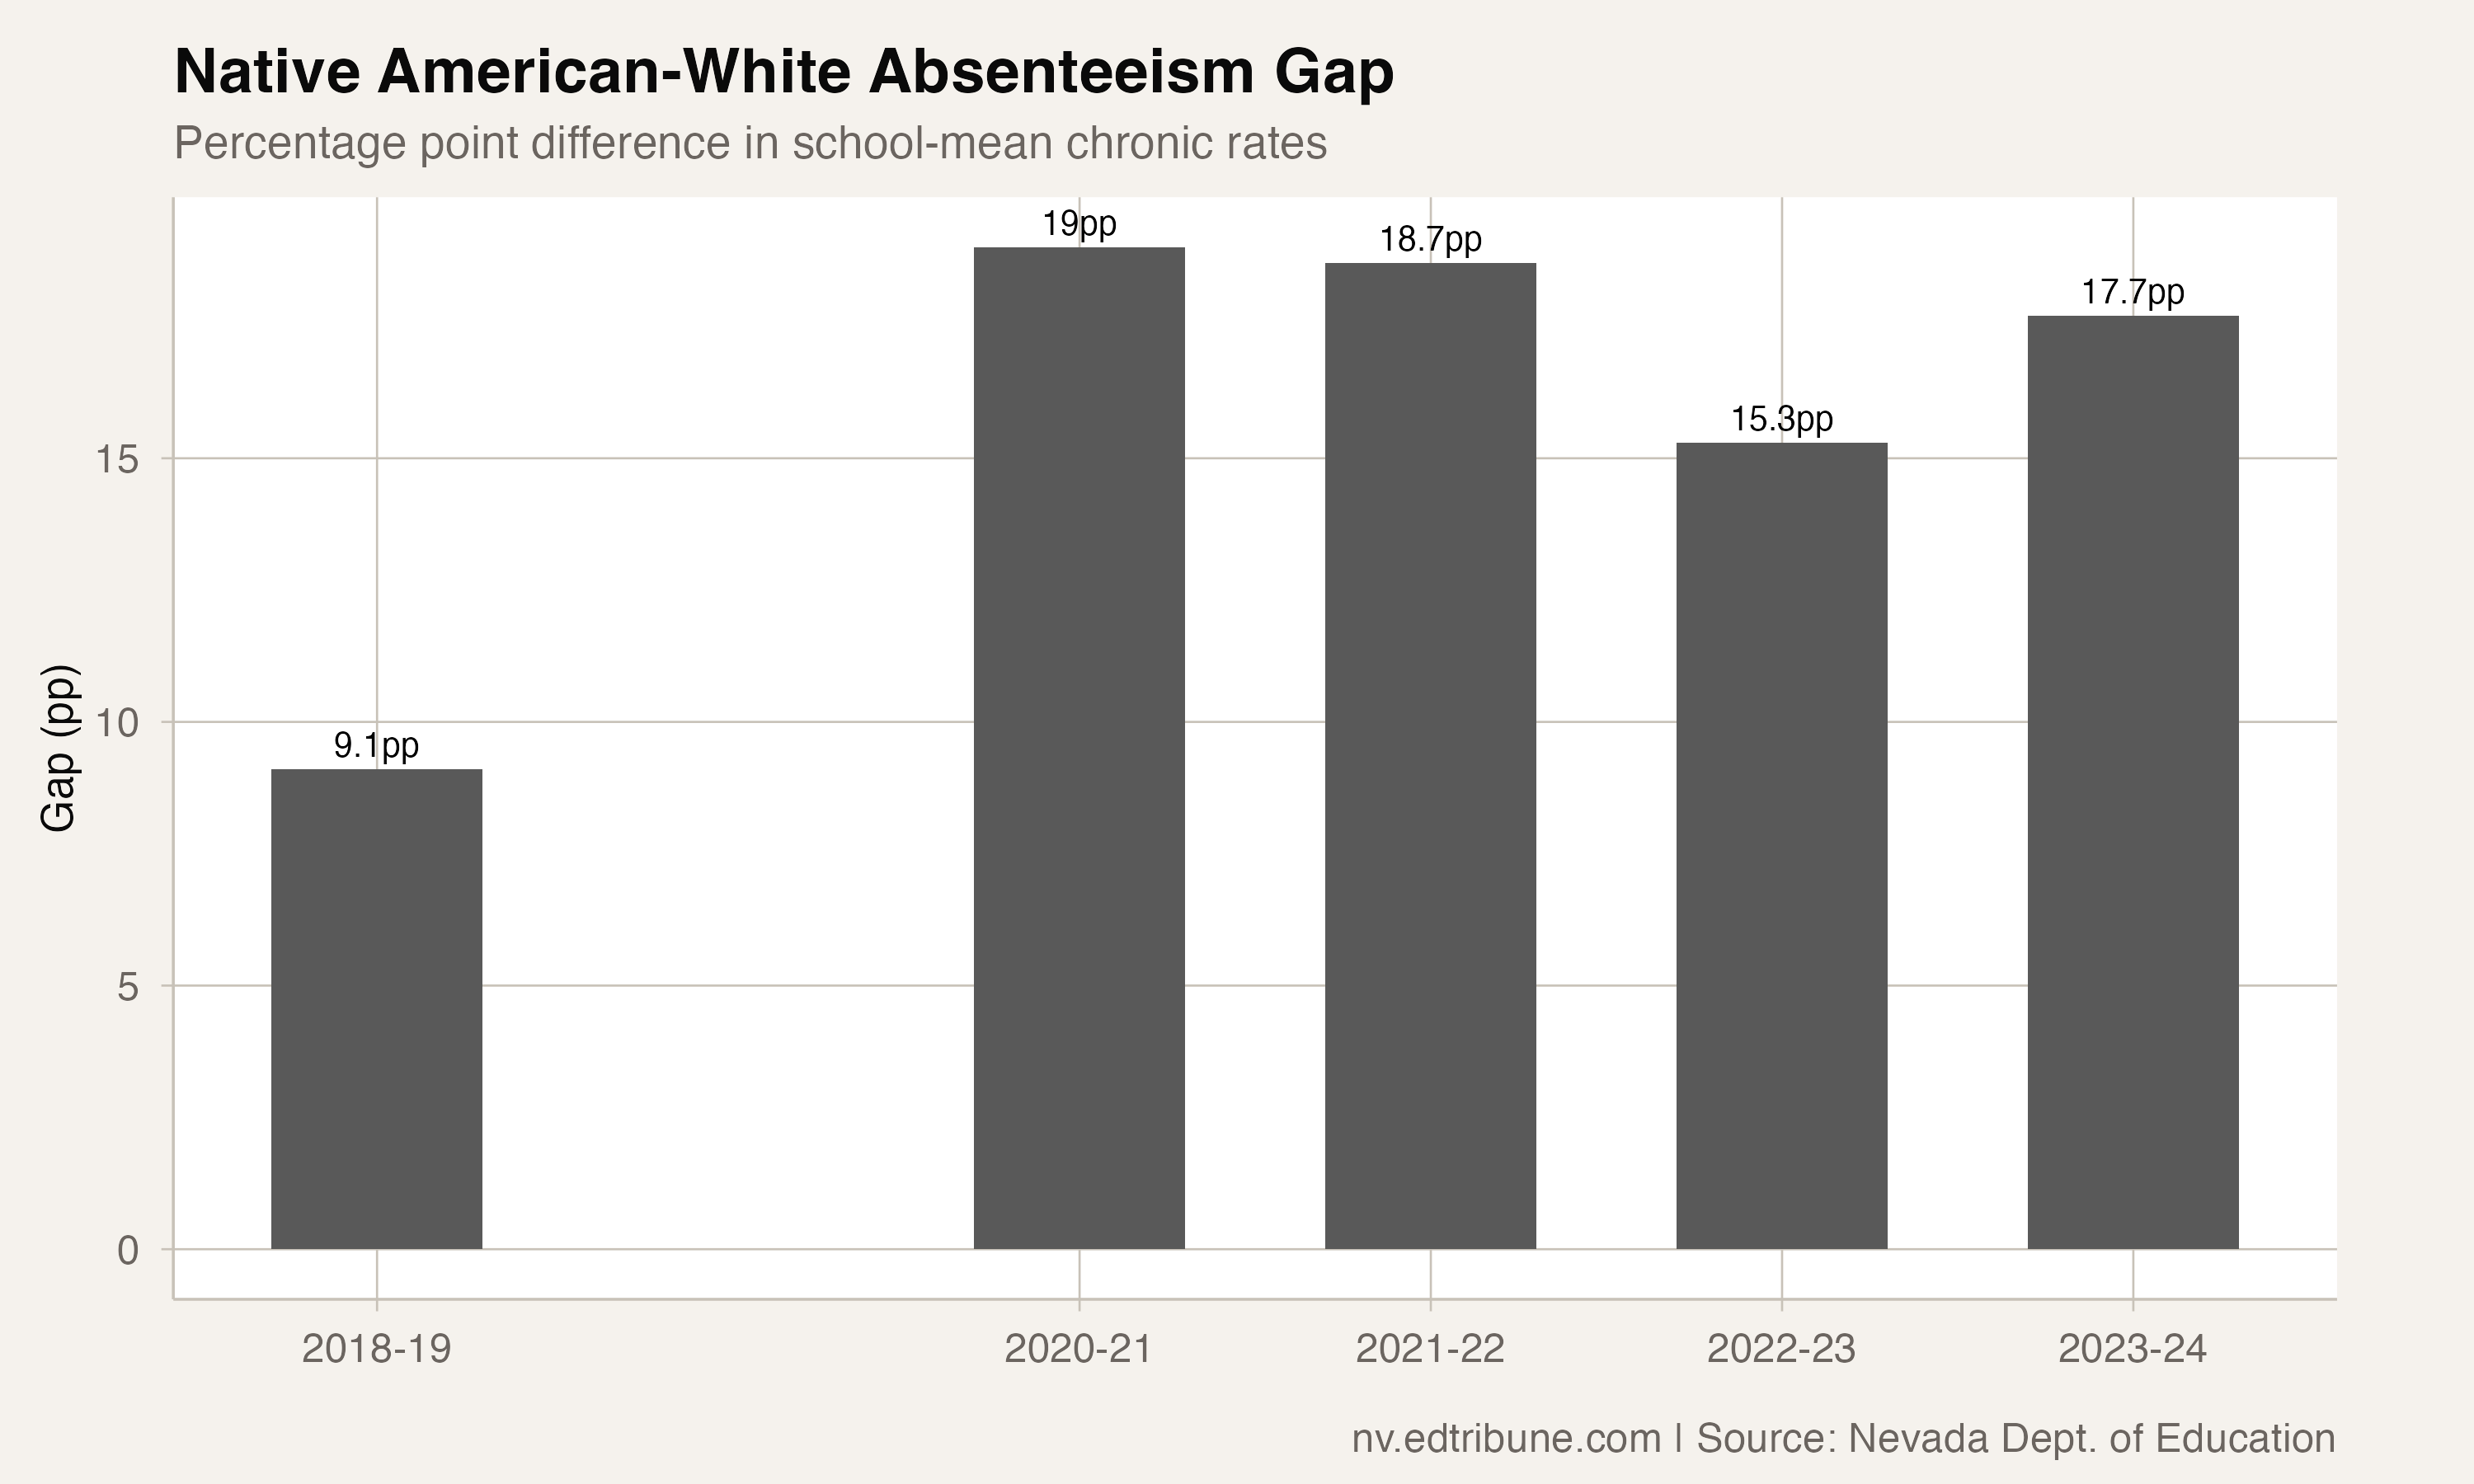
The catch: Native American students started so much higher than other groups that the gap with white students has nearly doubled since before the pandemic, from about 9 percentage points in 2018-19 to nearly 18 points in 2023-24. Every racial group's chronic rates surged during COVID, but Native American students climbed the highest and remain the furthest above pre-pandemic levels.
Recovery in raw points, but not enough to close the gap
In 2021-22, the school-mean chronic rate for Native American students reached 51.5%, meaning more than half were chronically absent at the average school reporting this subgroup. By 2023-24, the rate had declined to 44.8%, a 6.7-point improvement over two years. That tracks closely with the recovery seen for other groups: white students dropped from 32.8% to 27.1% (5.7 points), and Black students fell from 44.6% to 37.8% (6.8 points). In raw terms, the Native American recovery is comparable. In proportional terms, it lags because Native American rates started so much higher.
The pre-COVID baseline tells the deeper story. Native American students were already at 29.6% chronic absenteeism in 2018-19, when white students were at 20.5% and the statewide average was 19.9%. Native American students entered the pandemic with a chronic absenteeism problem that was already half again as severe as the average. COVID magnified that gap rather than creating it.
Where the data lives
About 100 schools statewide report Native American chronic absenteeism data, roughly 15% of Nevada's 685 schools. These are concentrated in rural districts with significant Native American populations: Elko County↗ET, which includes portions of the Western Shoshone and Te-Moak reservations; Nye County↗ET, near the Duckwater Shoshone Reservation; and Humboldt County↗ET, home to Winnemucca Indian Colony. Clark↗ET and Washoe↗ET counties also report the subgroup at dozens of schools, primarily reflecting Native American families in urban areas.
The small reporting footprint means these numbers carry more volatility than state-level figures for larger groups. A handful of families in a rural school can shift a rate by several points. But the consistency of the pattern across five years and 100 schools, always the highest or second-highest of any racial group, argues against dismissing it as noise.
The compounding factors
The reasons are structural and overlapping. Nevada ranks 51st nationally for youth mental health access, according to Mental Health America, meaning last among all states and the District of Columbia. Rural communities where many Native American families live face the worst of that shortage, often with no behavioral health provider within an hour's drive.
Transportation barriers are acute on and near reservation land, where some families live 30 or more miles from the nearest school. The Inter-Tribal Council of Nevada has documented that families in remote areas face daily round trips of two hours or more, making every illness, car breakdown, or weather event a potential absence.
Historical context matters too. For generations, Bureau of Indian Education and government-run boarding schools disrupted Indigenous communities' relationships with formal schooling. The legacy of forced assimilation policies means many Native American families approach public schools with well-founded skepticism. Building attendance requires building trust, which requires sustained investment in culturally responsive education that goes beyond token gestures.
The gap within the gap
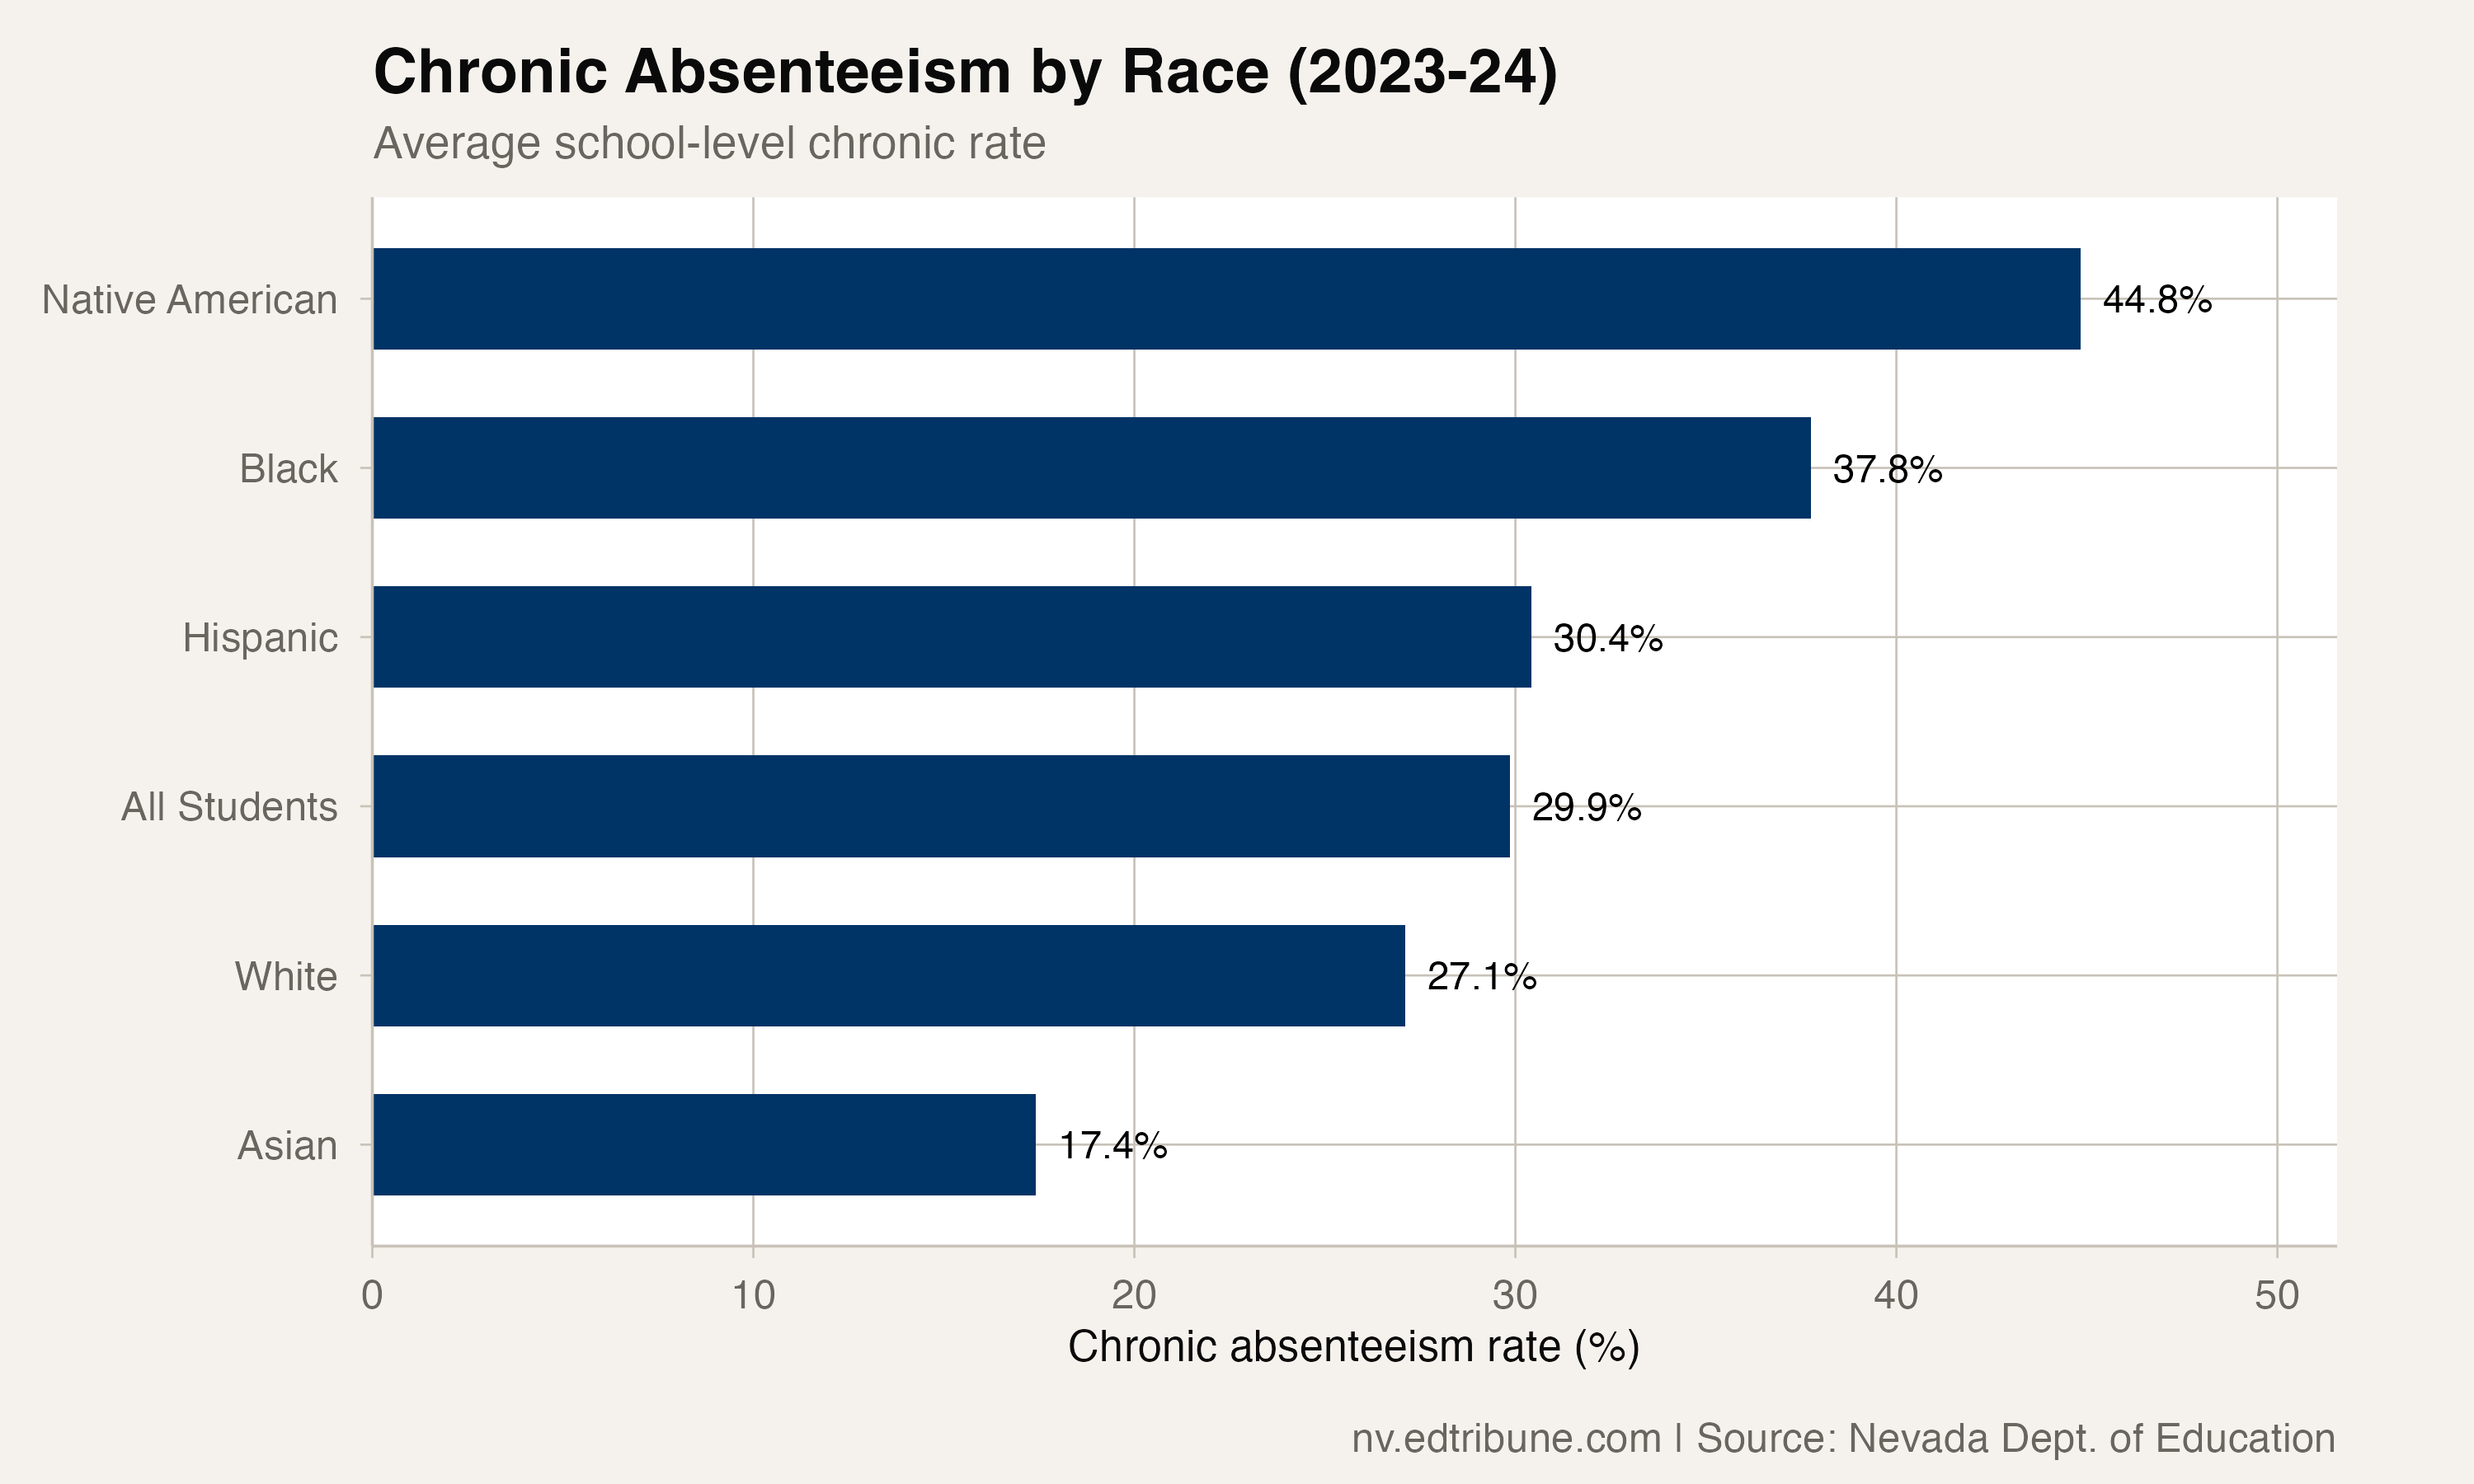
Asian students, by contrast, have a school-mean chronic rate of 17.4%, less than half the Native American rate and the lowest of any racial group. Hispanic students (30.4%) and Black students (37.8%) fall between the extremes. The full range from Asian to Native American spans 27.4 percentage points, a chasm that reflects compounding layers of advantage and disadvantage playing out through the single metric of school attendance.
The 2024-25 racial subgroup data is not included in this analysis because of a methodology break in how schools report subgroup information. The number of schools reporting racial subgroups changed substantially in 2025, making year-over-year comparisons unreliable. The 2023-24 figures represent the most recent clean data point.
Detailed code that reproduces the analysis and figures in this article is available exclusively to EdTribune subscribers.
Discussion
Sign in to join the discussion.
Loading comments...