Washoe County School District↗ET, Nevada's second-largest, does not make headlines for chronic absenteeism the way Clark County does. Its numbers are not as dire, its scale is not as staggering, and its trajectory, while far from pre-COVID recovery, is quietly better than much of the state. That relative success is worth understanding.
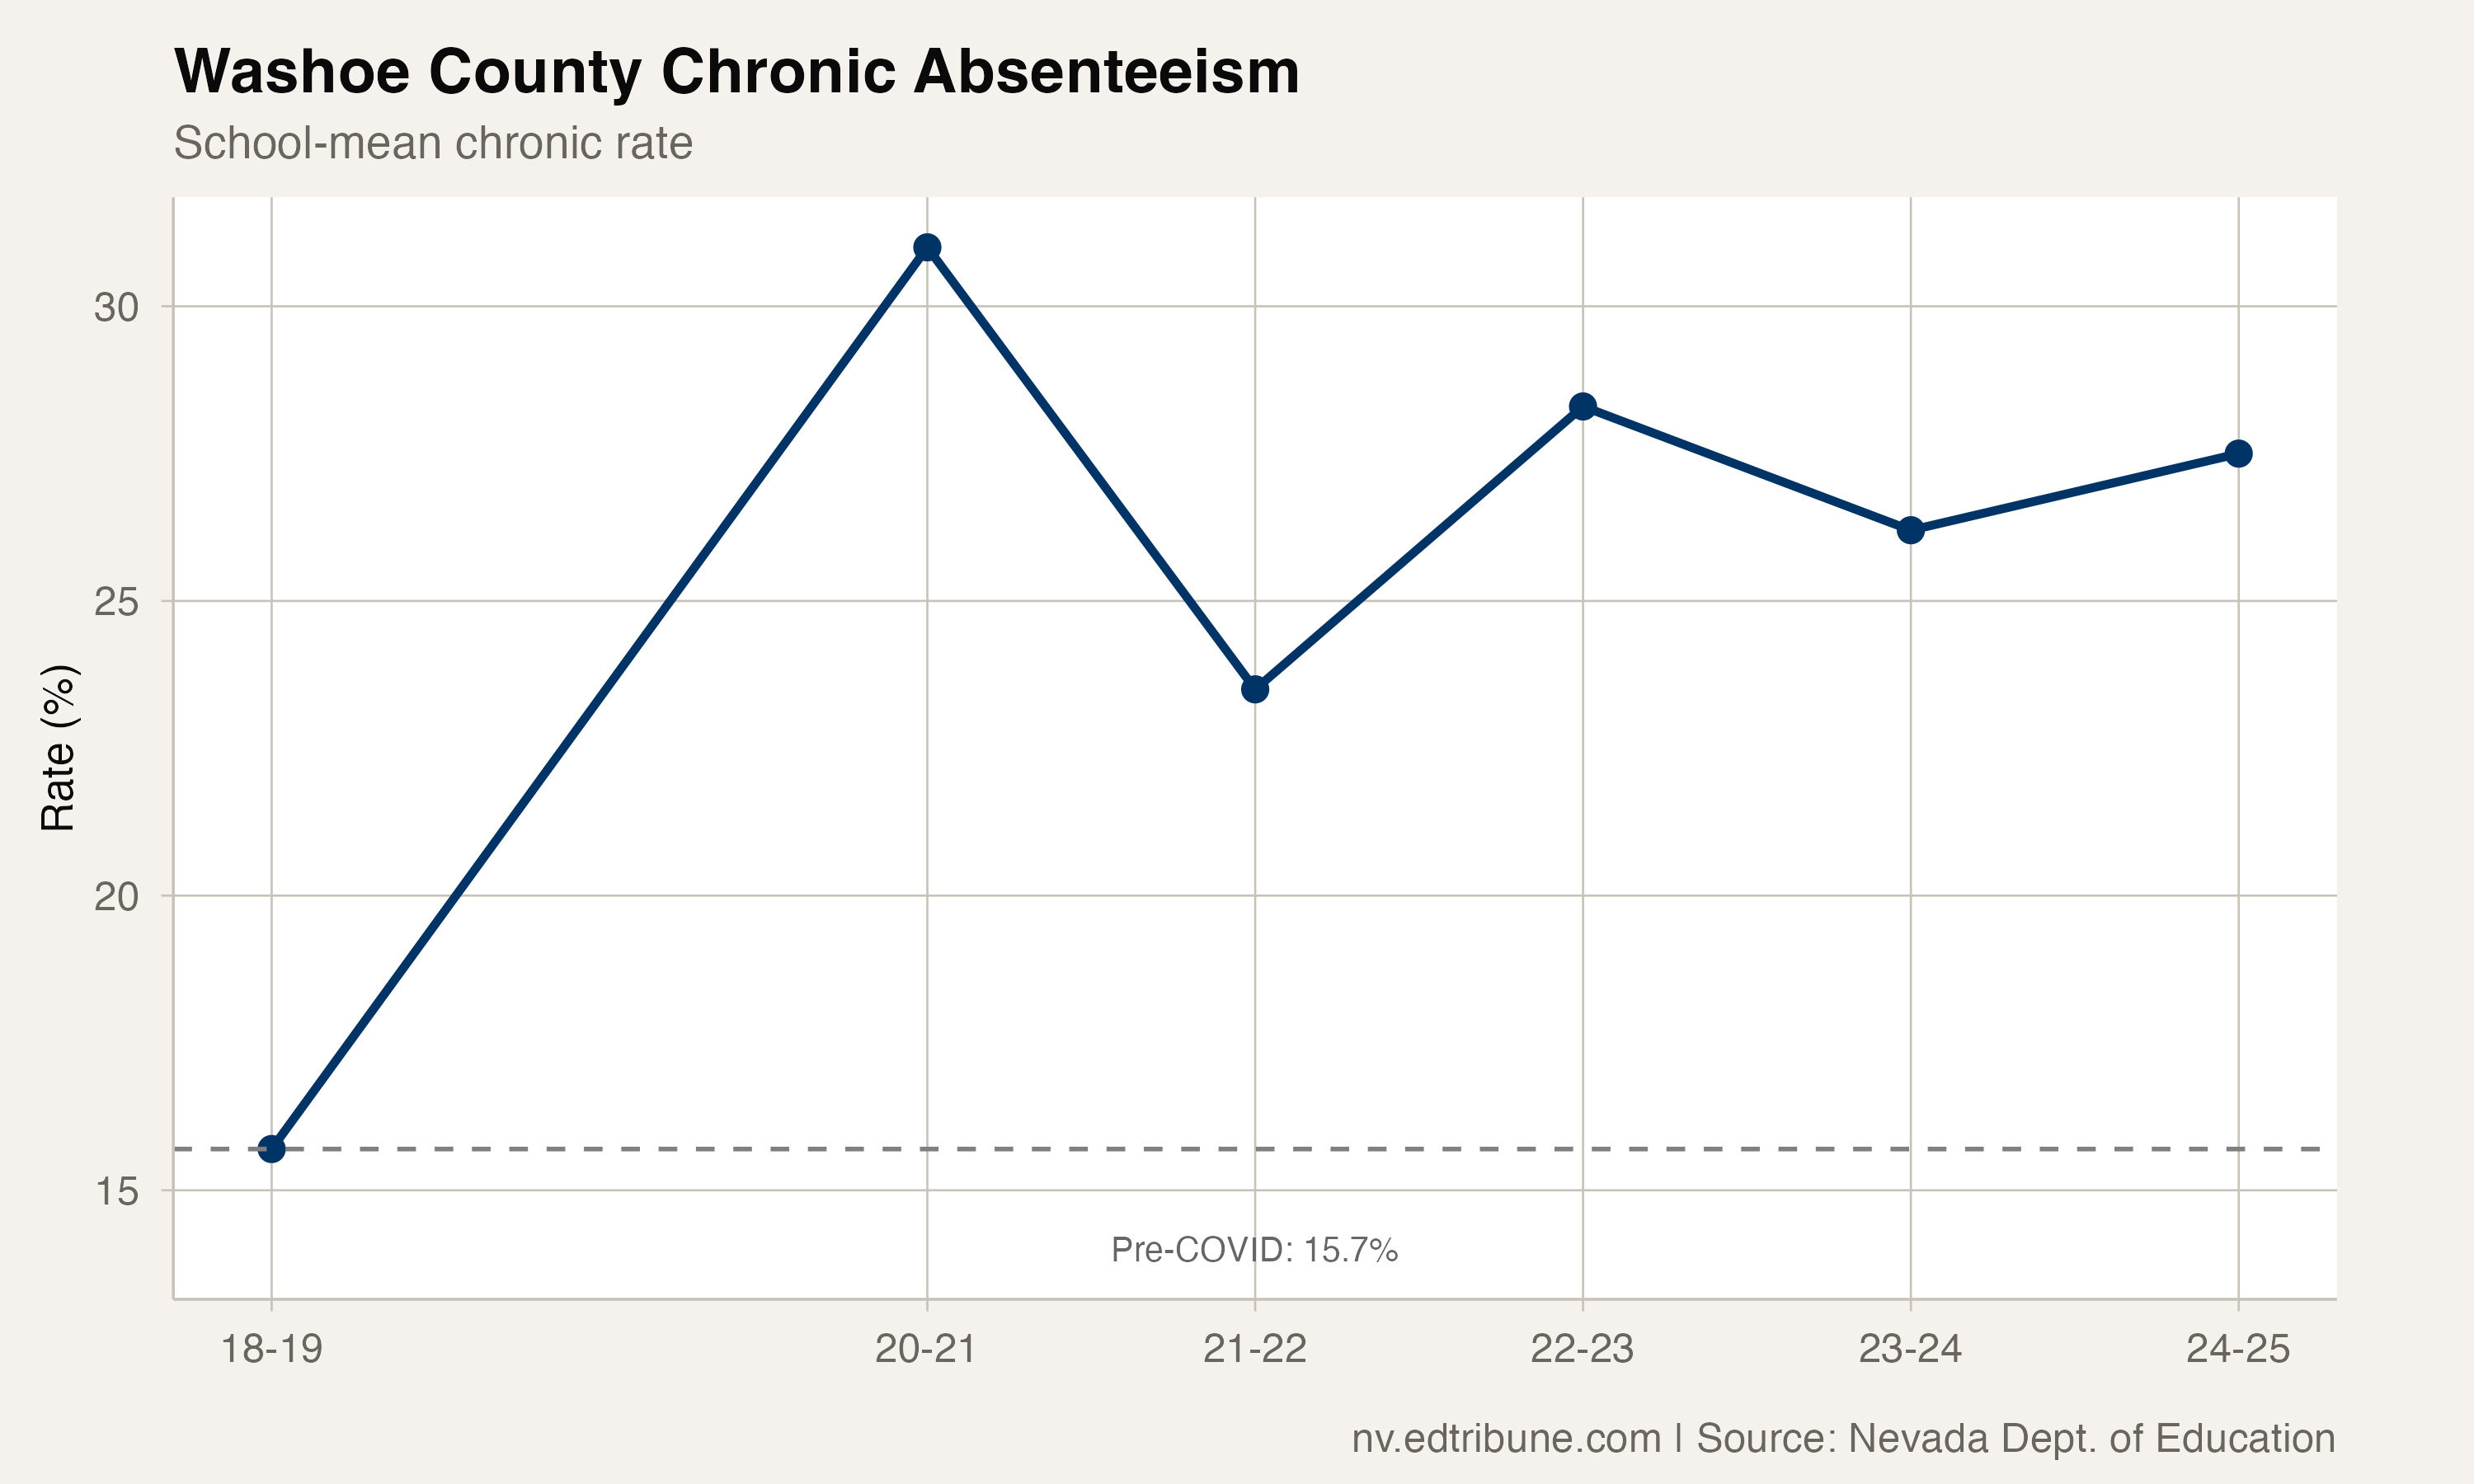
The district's 2024-25 enrollment-weighted chronic rate of 30.5% is 4.5 percentage points below Clark County↗ET at 35%. Its school-mean rate of 27.5% has declined from the 2020-21 peak of 31.0%, a trajectory that includes an unusual dip to 23.5% in 2021-22 before rising again. The district serves 63,628 students across 111 schools, roughly one-fifth the scale of Clark.
The Clark gap
The comparison between Nevada's two urban centers is revealing. Before COVID, Washoe's school-mean chronic rate of 15.7% was nearly 6 points below Clark's 21.5%. During the pandemic disruption, the gap briefly vanished: both districts hit approximately 31% in 2020-21. Then their paths diverged.
Clark surged to 40.5% in 2021-22 while Washoe dropped to 23.5%, a 17-point gap in the opposite direction from the converged 2021 rates. This anomalous dip likely reflects differences in how the two districts counted chronic absenteeism during the transition back to in-person learning. Since then, Clark has improved from its 40.5% peak to 33.3%, while Washoe's rate has settled in the 26-28% range after rebounding from the 2022 dip.
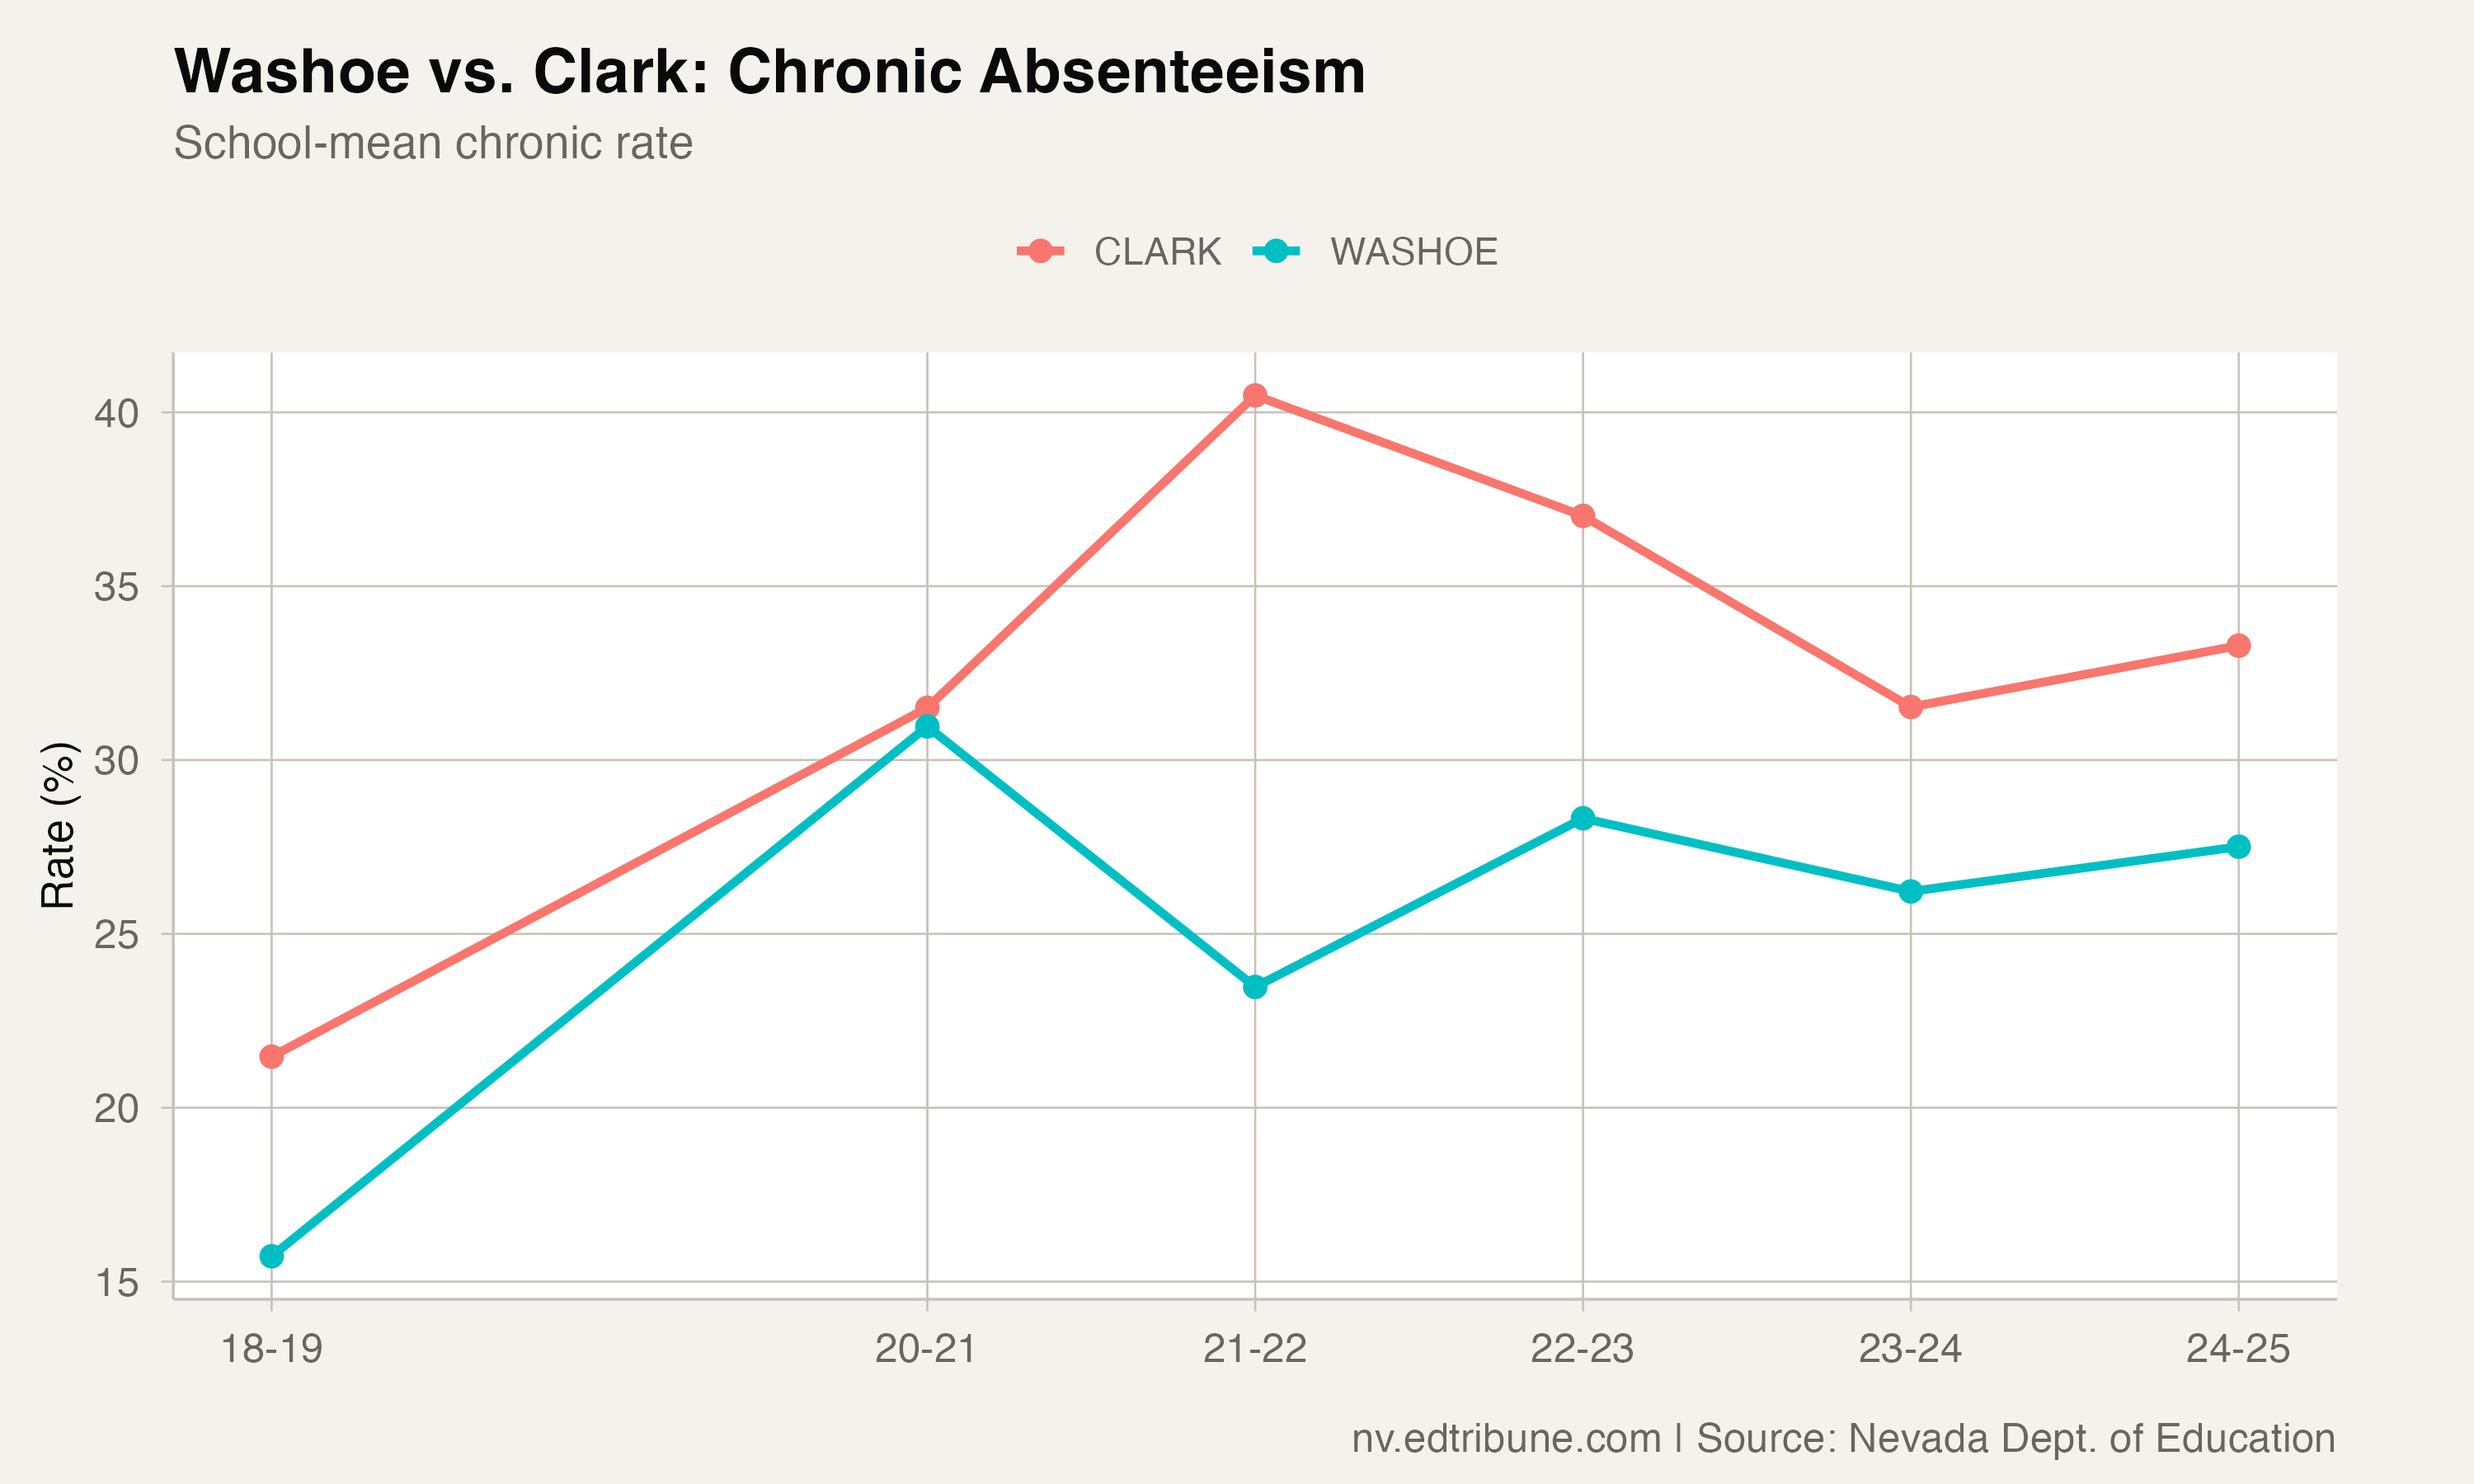
The net result: Washoe consistently runs 5-6 points below Clark, roughly the same gap as before the pandemic. The pandemic did not fundamentally change the relationship between the two districts, but it elevated both to permanently higher levels.
Investments in attendance
Washoe County has made attendance a visible priority. The district launched expanded after-school programming, created more than 360 student clubs, and expanded athletics offerings designed to give students reasons to be at school beyond academics. WCSD reported historic increases in ELA and math proficiency for the 2024-25 school year, suggesting that whatever is improving attendance may also be improving learning outcomes.
The district has also invested in dedicated attendance staff and participated in the Communities In Schools model. These are not unique interventions -- Clark County has deployed similar programs at larger scale -- but Washoe's smaller size may allow more cohesive implementation.
The 2025 setback
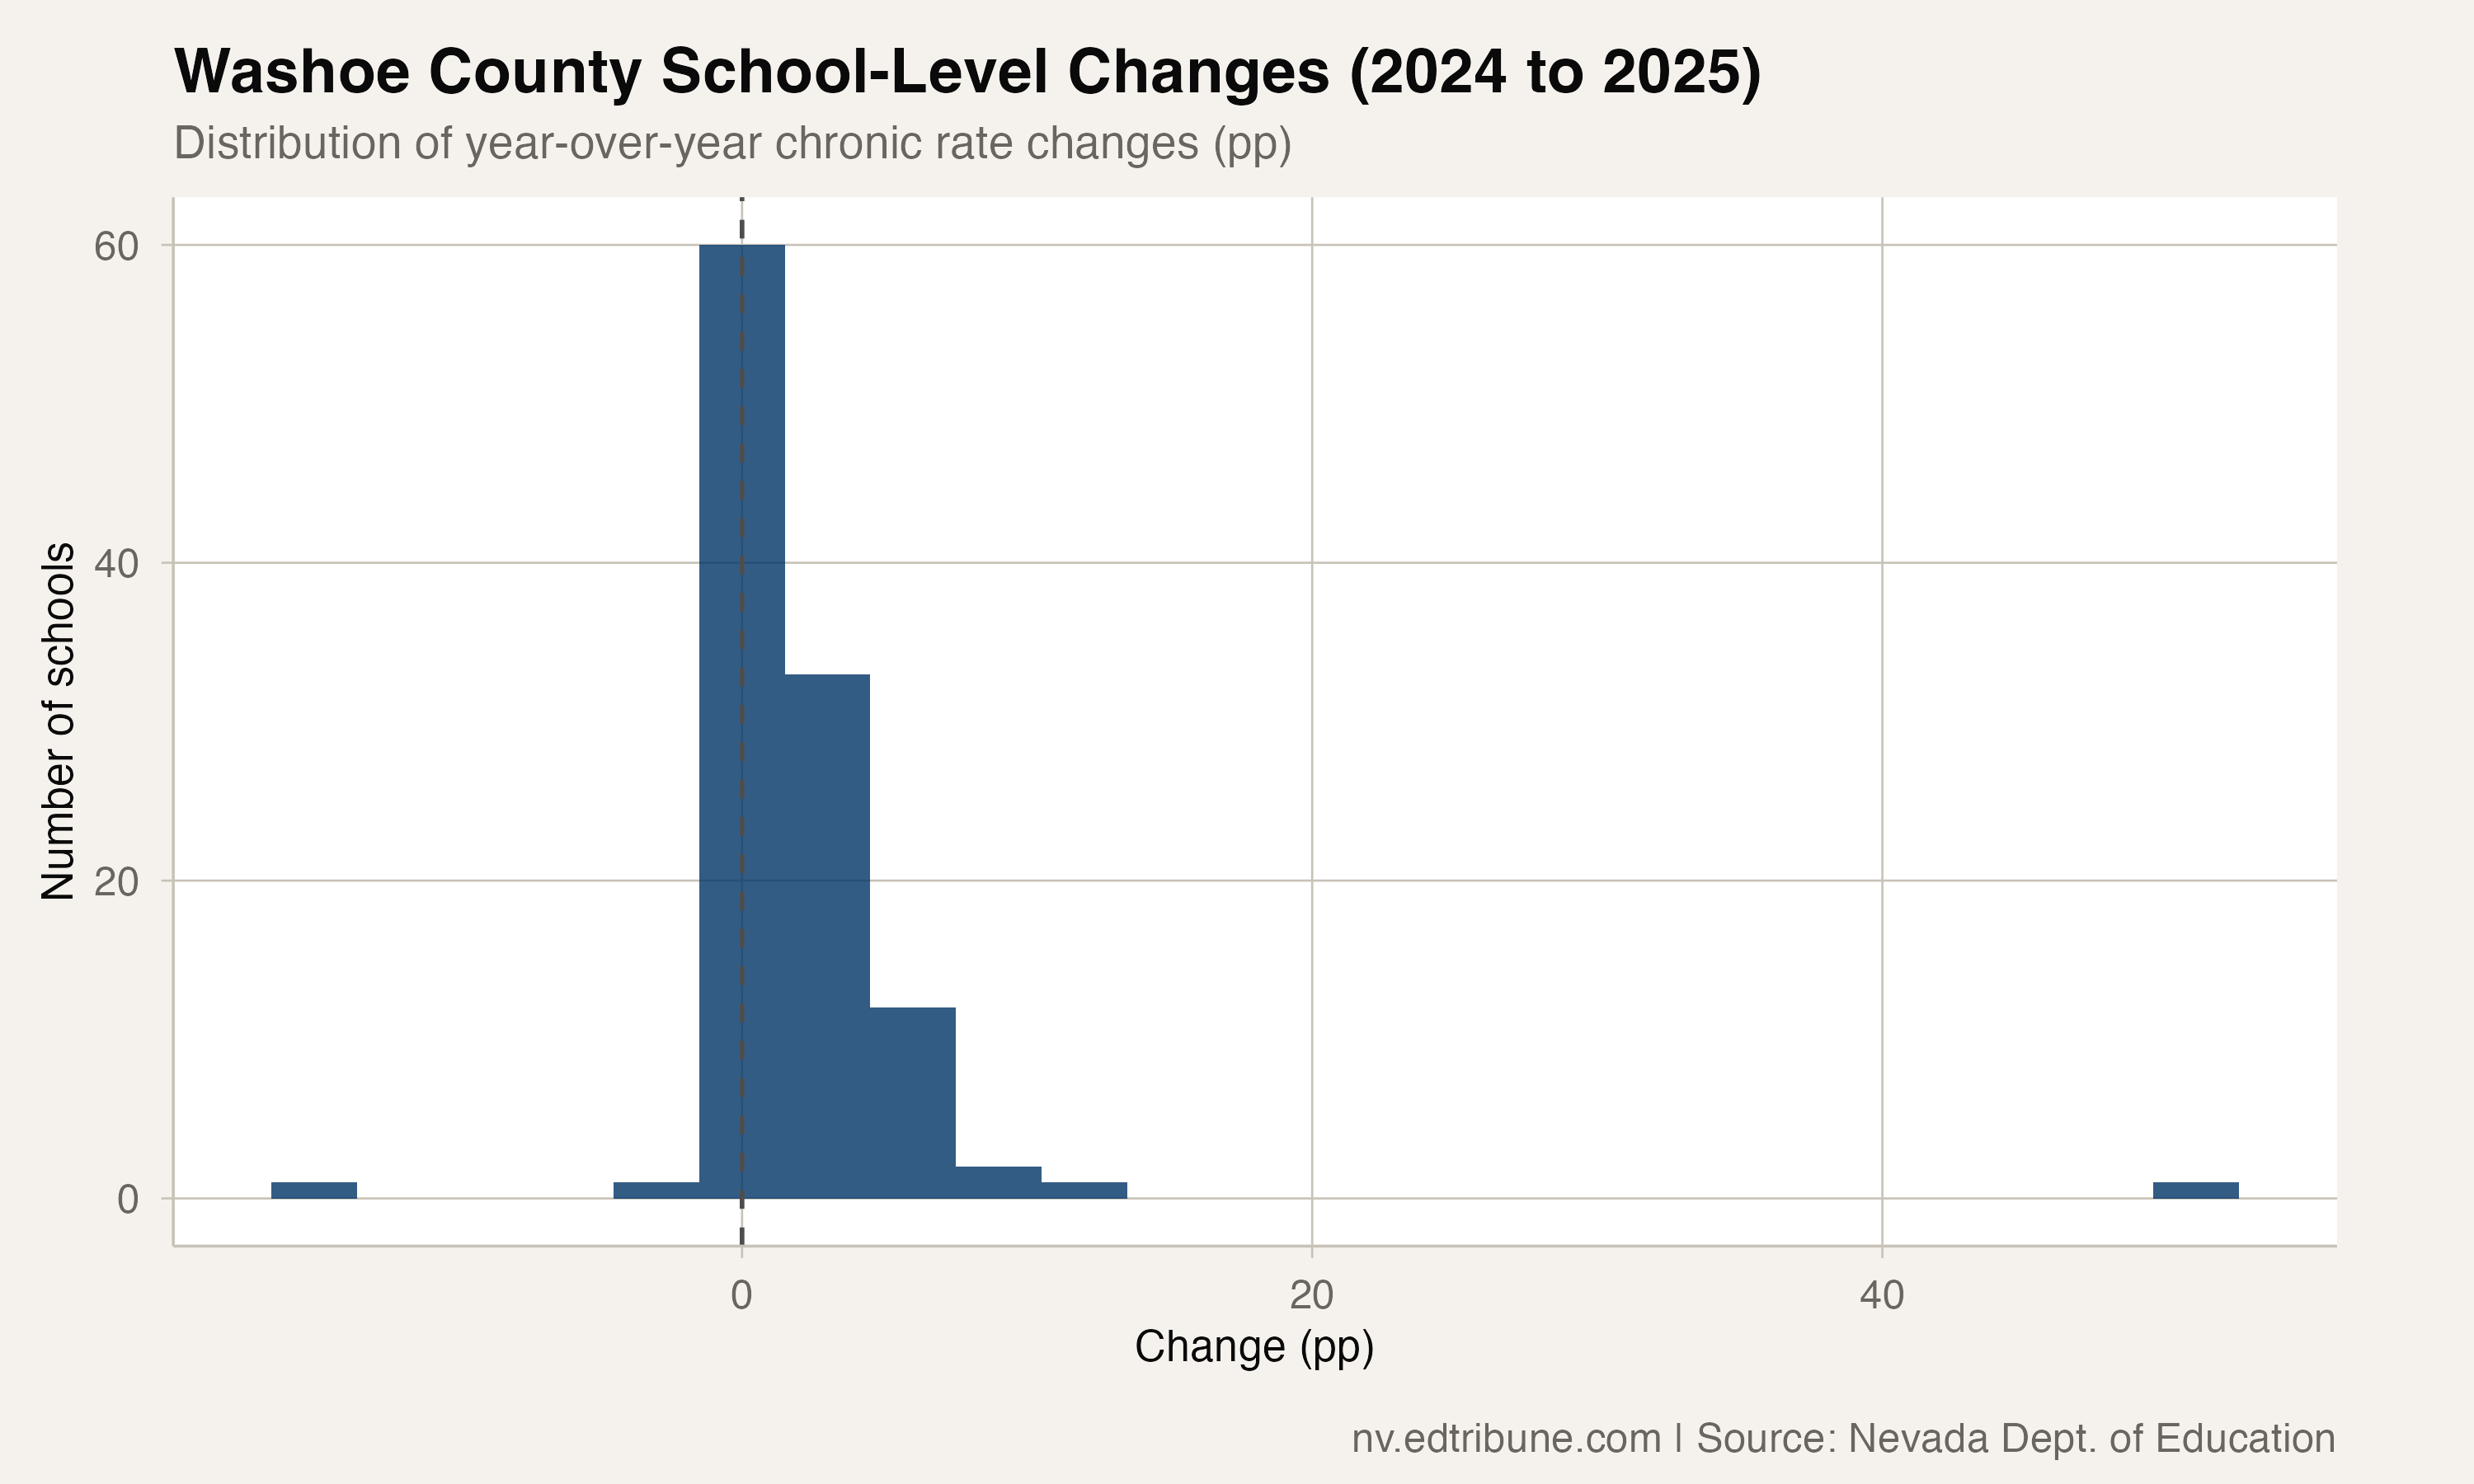
Washoe was not immune to the statewide 2025 reversal. The district's school-mean rate ticked up from 26.2% to 27.5%, a 1.3-point increase that matches the statewide pattern. The setback was broad-based: of the 111 schools with data in both 2023-24 and 2024-25, 96 saw rates rise, 13 improved, and two were unchanged. The median school's chronic rate moved 1.3 points in the wrong direction. Eight schools finished the year above 50%, including Washoe Inspire Academy at 94.6% (130 students), an alternative program with structurally high absenteeism.
What Washoe is not
A 30.5% weighted chronic rate is not a success story in absolute terms. It means roughly 19,400 of the district's 63,628 students are chronically absent. The pre-COVID school-mean rate was 15.7%, and the current 27.5% represents barely 22.9% recovery from the pandemic surge.
But in a state where 16 of 17 districts remain deeply elevated and the state average is 31.7%, Washoe's relative position is meaningful. The district demonstrates that a large urban Nevada district can sustain rates meaningfully below the state average, even if "meaningfully below" still means nearly one in three students missing too much school.
Detailed code that reproduces the analysis and figures in this article is available exclusively to EdTribune subscribers.
Discussion
Sign in to join the discussion.
Loading comments...