Correction (July 21, 2026): The most populated ten-point band in 2024-25 was 20-30%, not the previously stated band. This version reports the precise 75.7% relative decline in the number of school rows below 10%, fixes rate-band boundaries and removes unsupported interpretations of the 10% threshold, school-type composition, causes, interventions and policy.
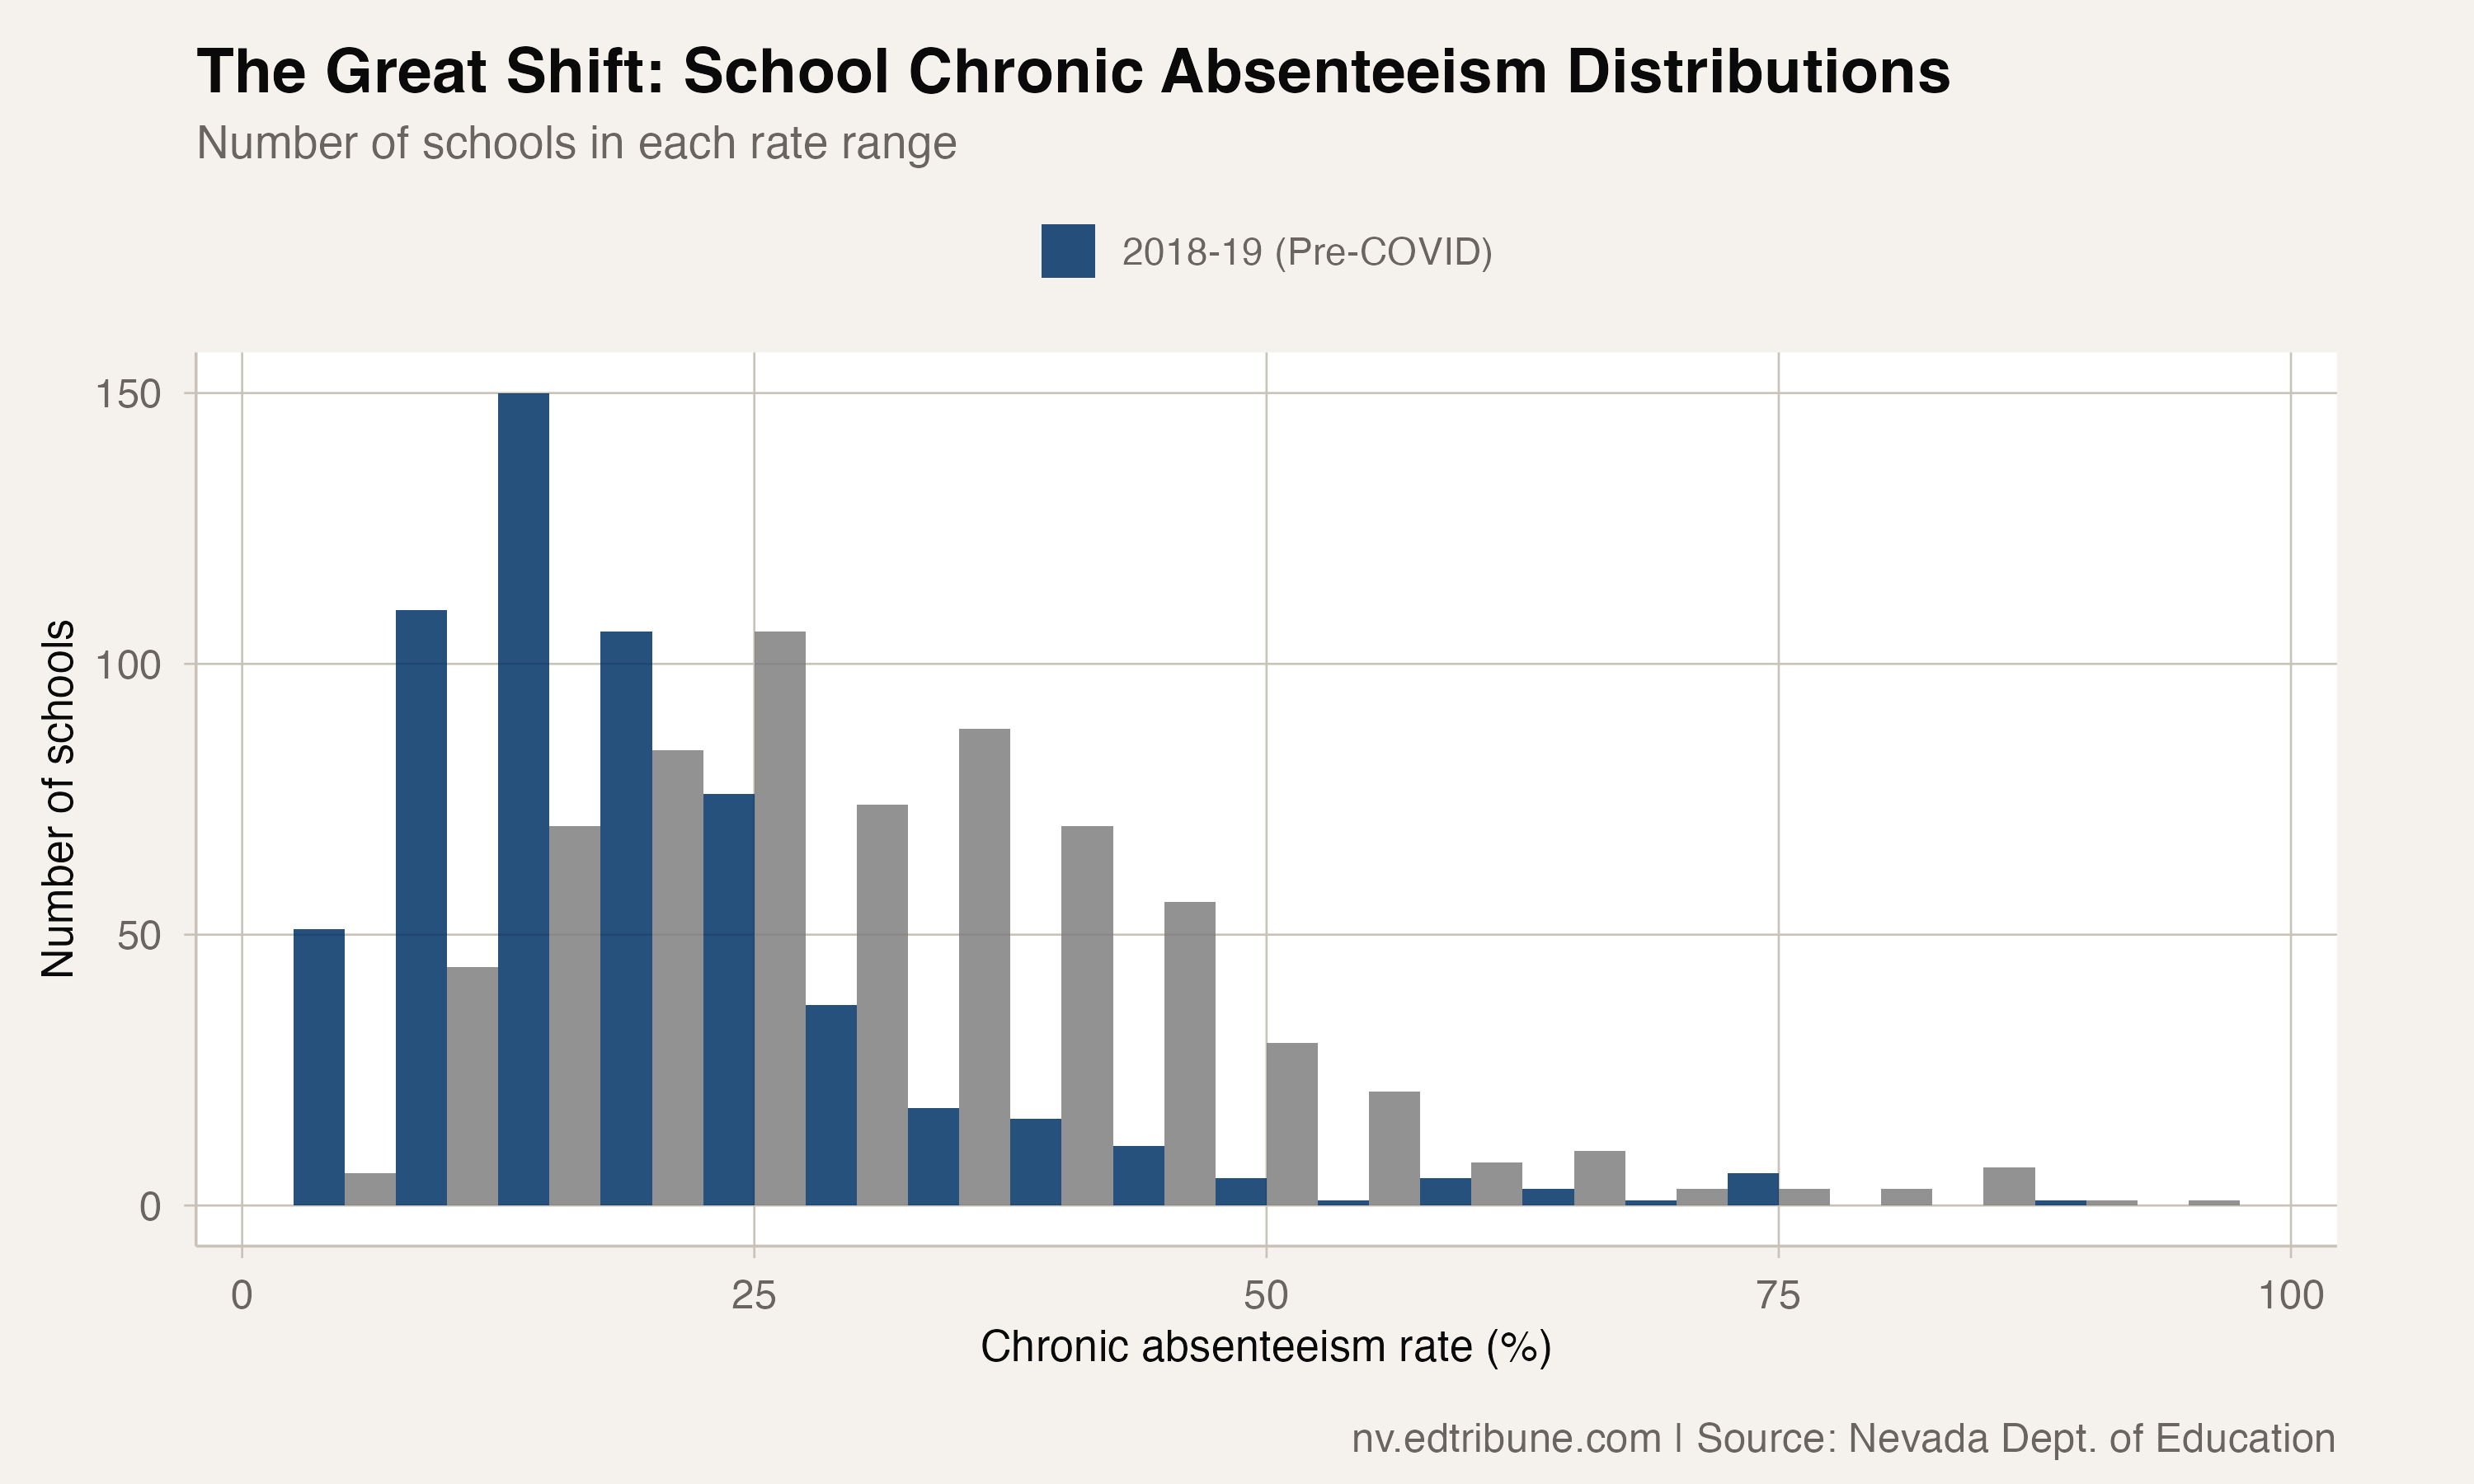
In 2018-19, 103 of 597 Nevada school rows had chronic-absence rates below 10%, or 17.3%. In 2024-25, 25 of 685 rows were below that threshold, or 3.6%. The count fell by 78 schools, a 75.7% relative decline, while the share fell 13.7 percentage points.
The rate bands shifted
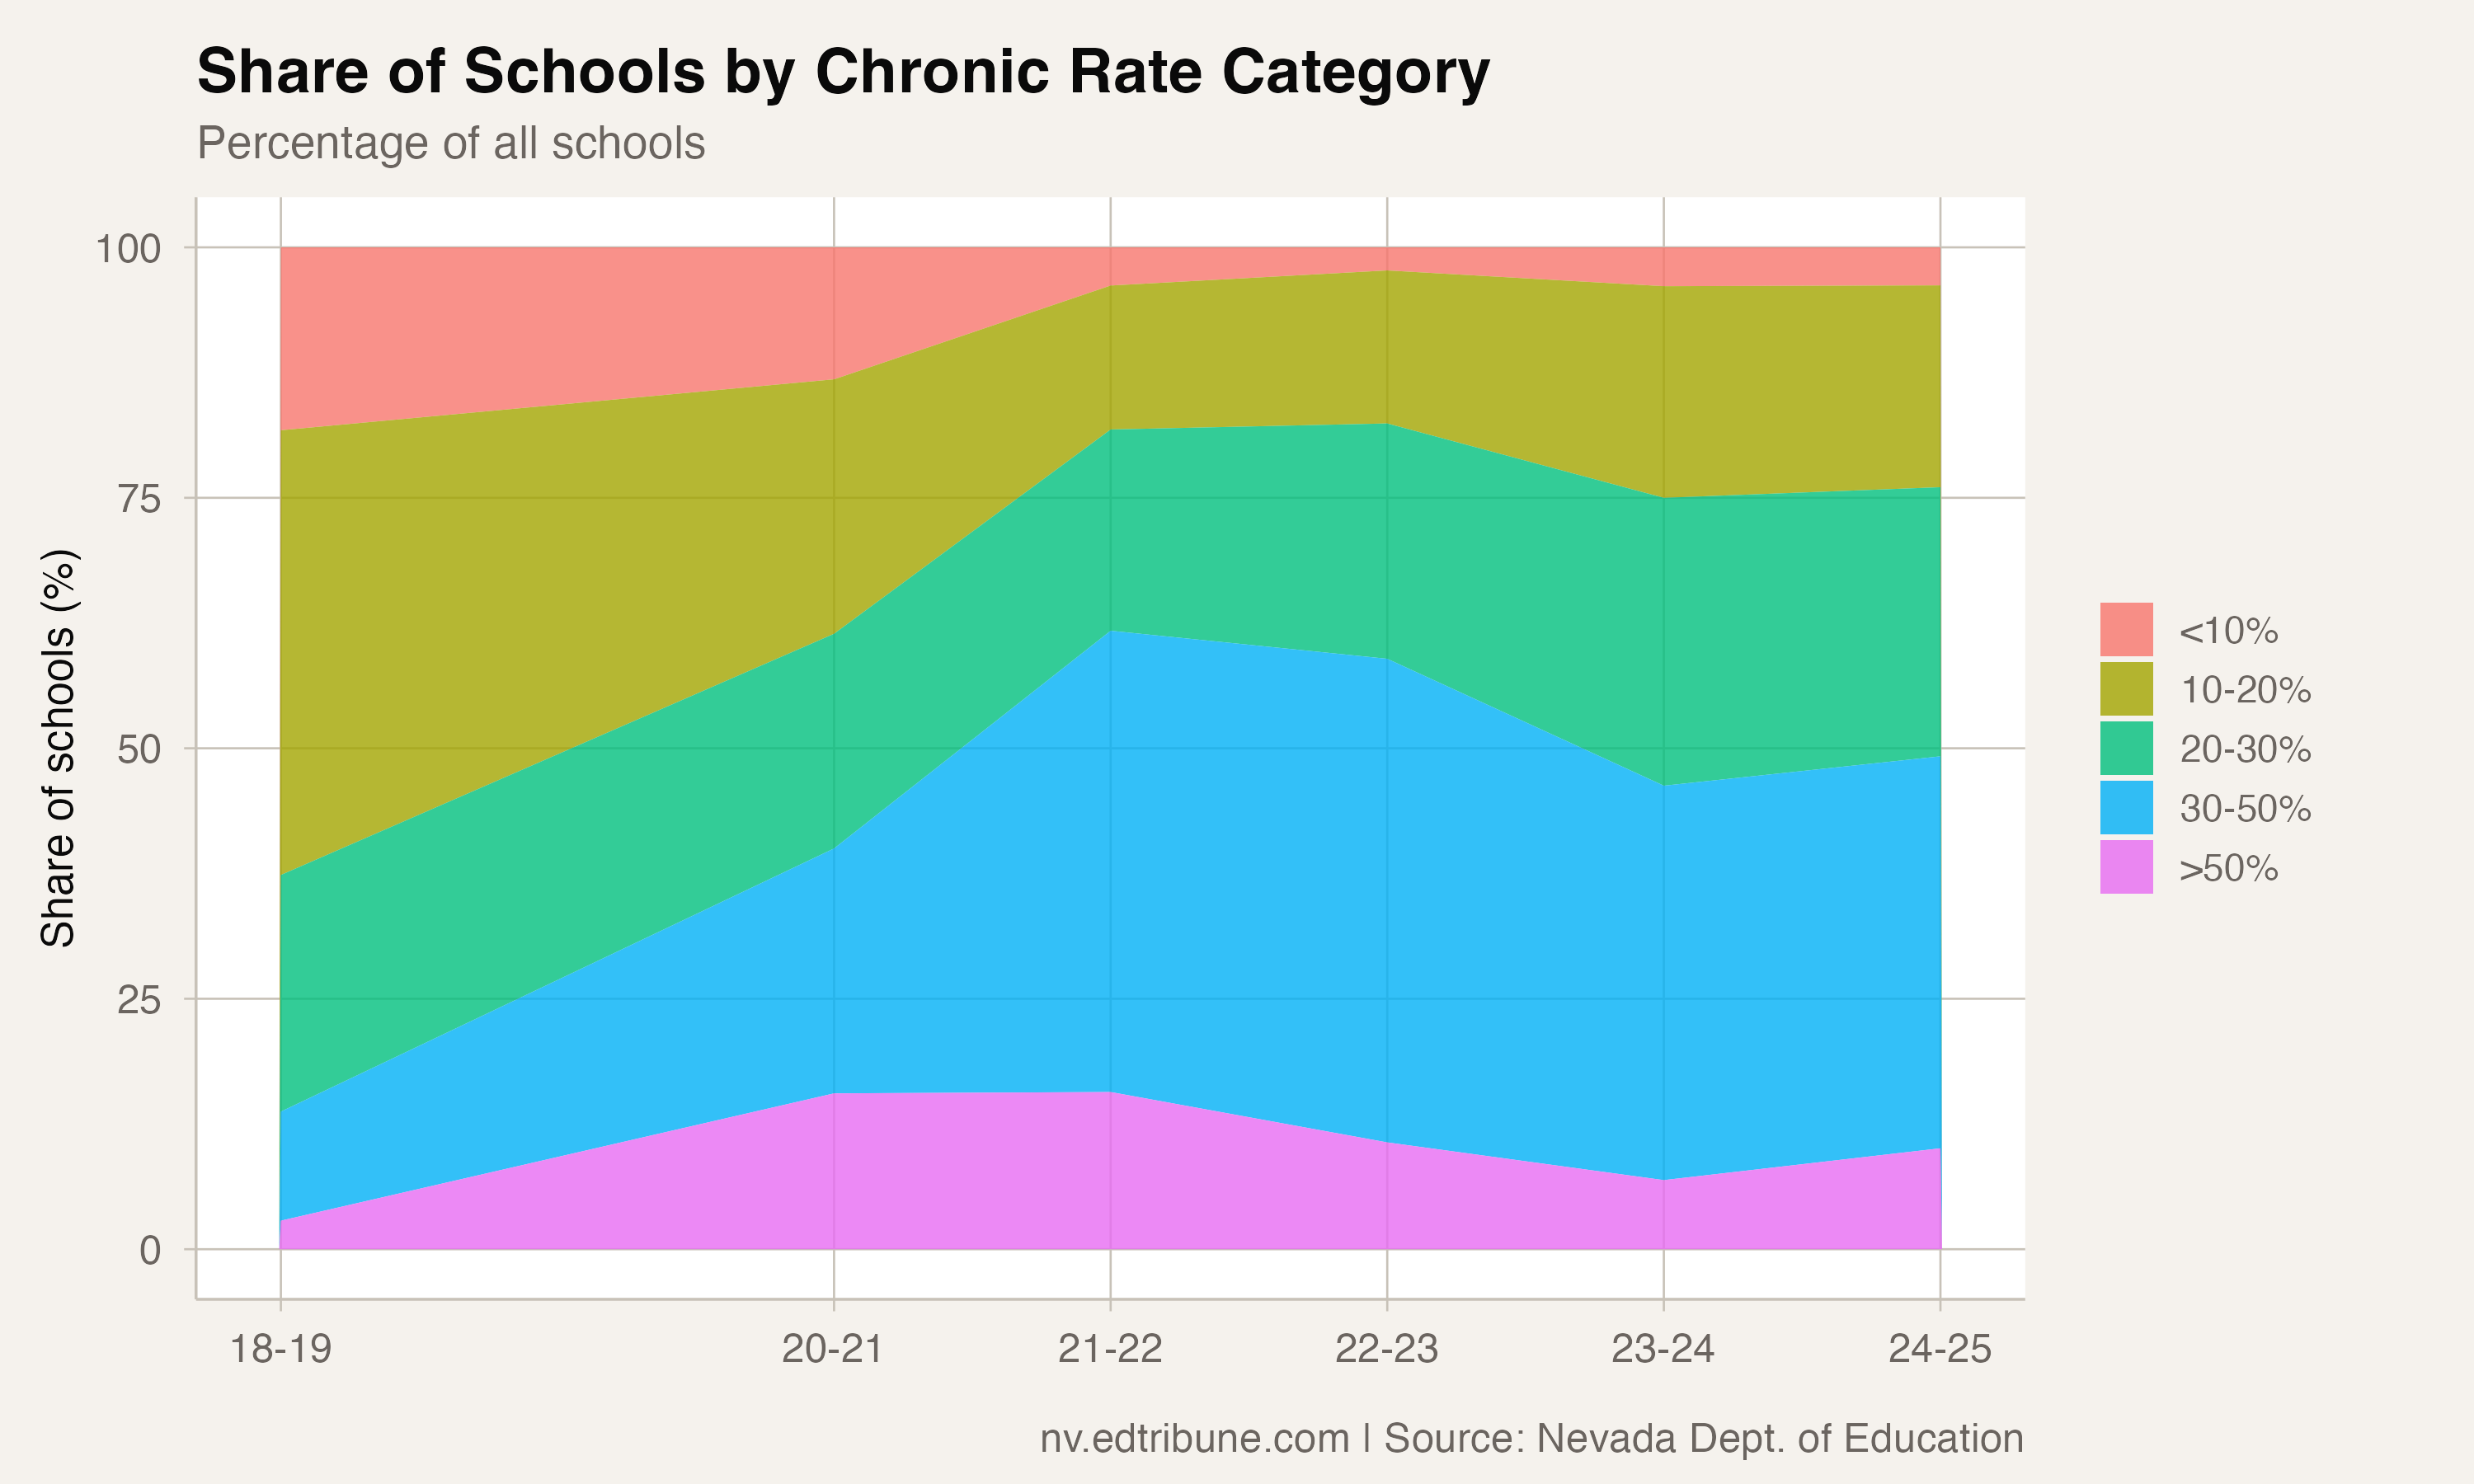
In 2018-19, 268 school rows were in the 10-20% band, or 44.9%. By 2024-25, that band contained 135 rows, or 19.7%.
The wider 30-50% band grew from 65 rows, or 10.9%, to 269 rows, or 39.3%. The 50%-and-above band grew from 18 rows, or 3.0%, to 70 rows, or 10.2%. Combining those bands, 83 school rows were at or above 30% in 2018-19, compared with 339 in 2024-25. The corresponding share rose from 13.9% to 49.5%.
The 20-30% band, with 186 rows and a 27.2% share, was the most populated ten-point band in 2024-25.
The below-10% path
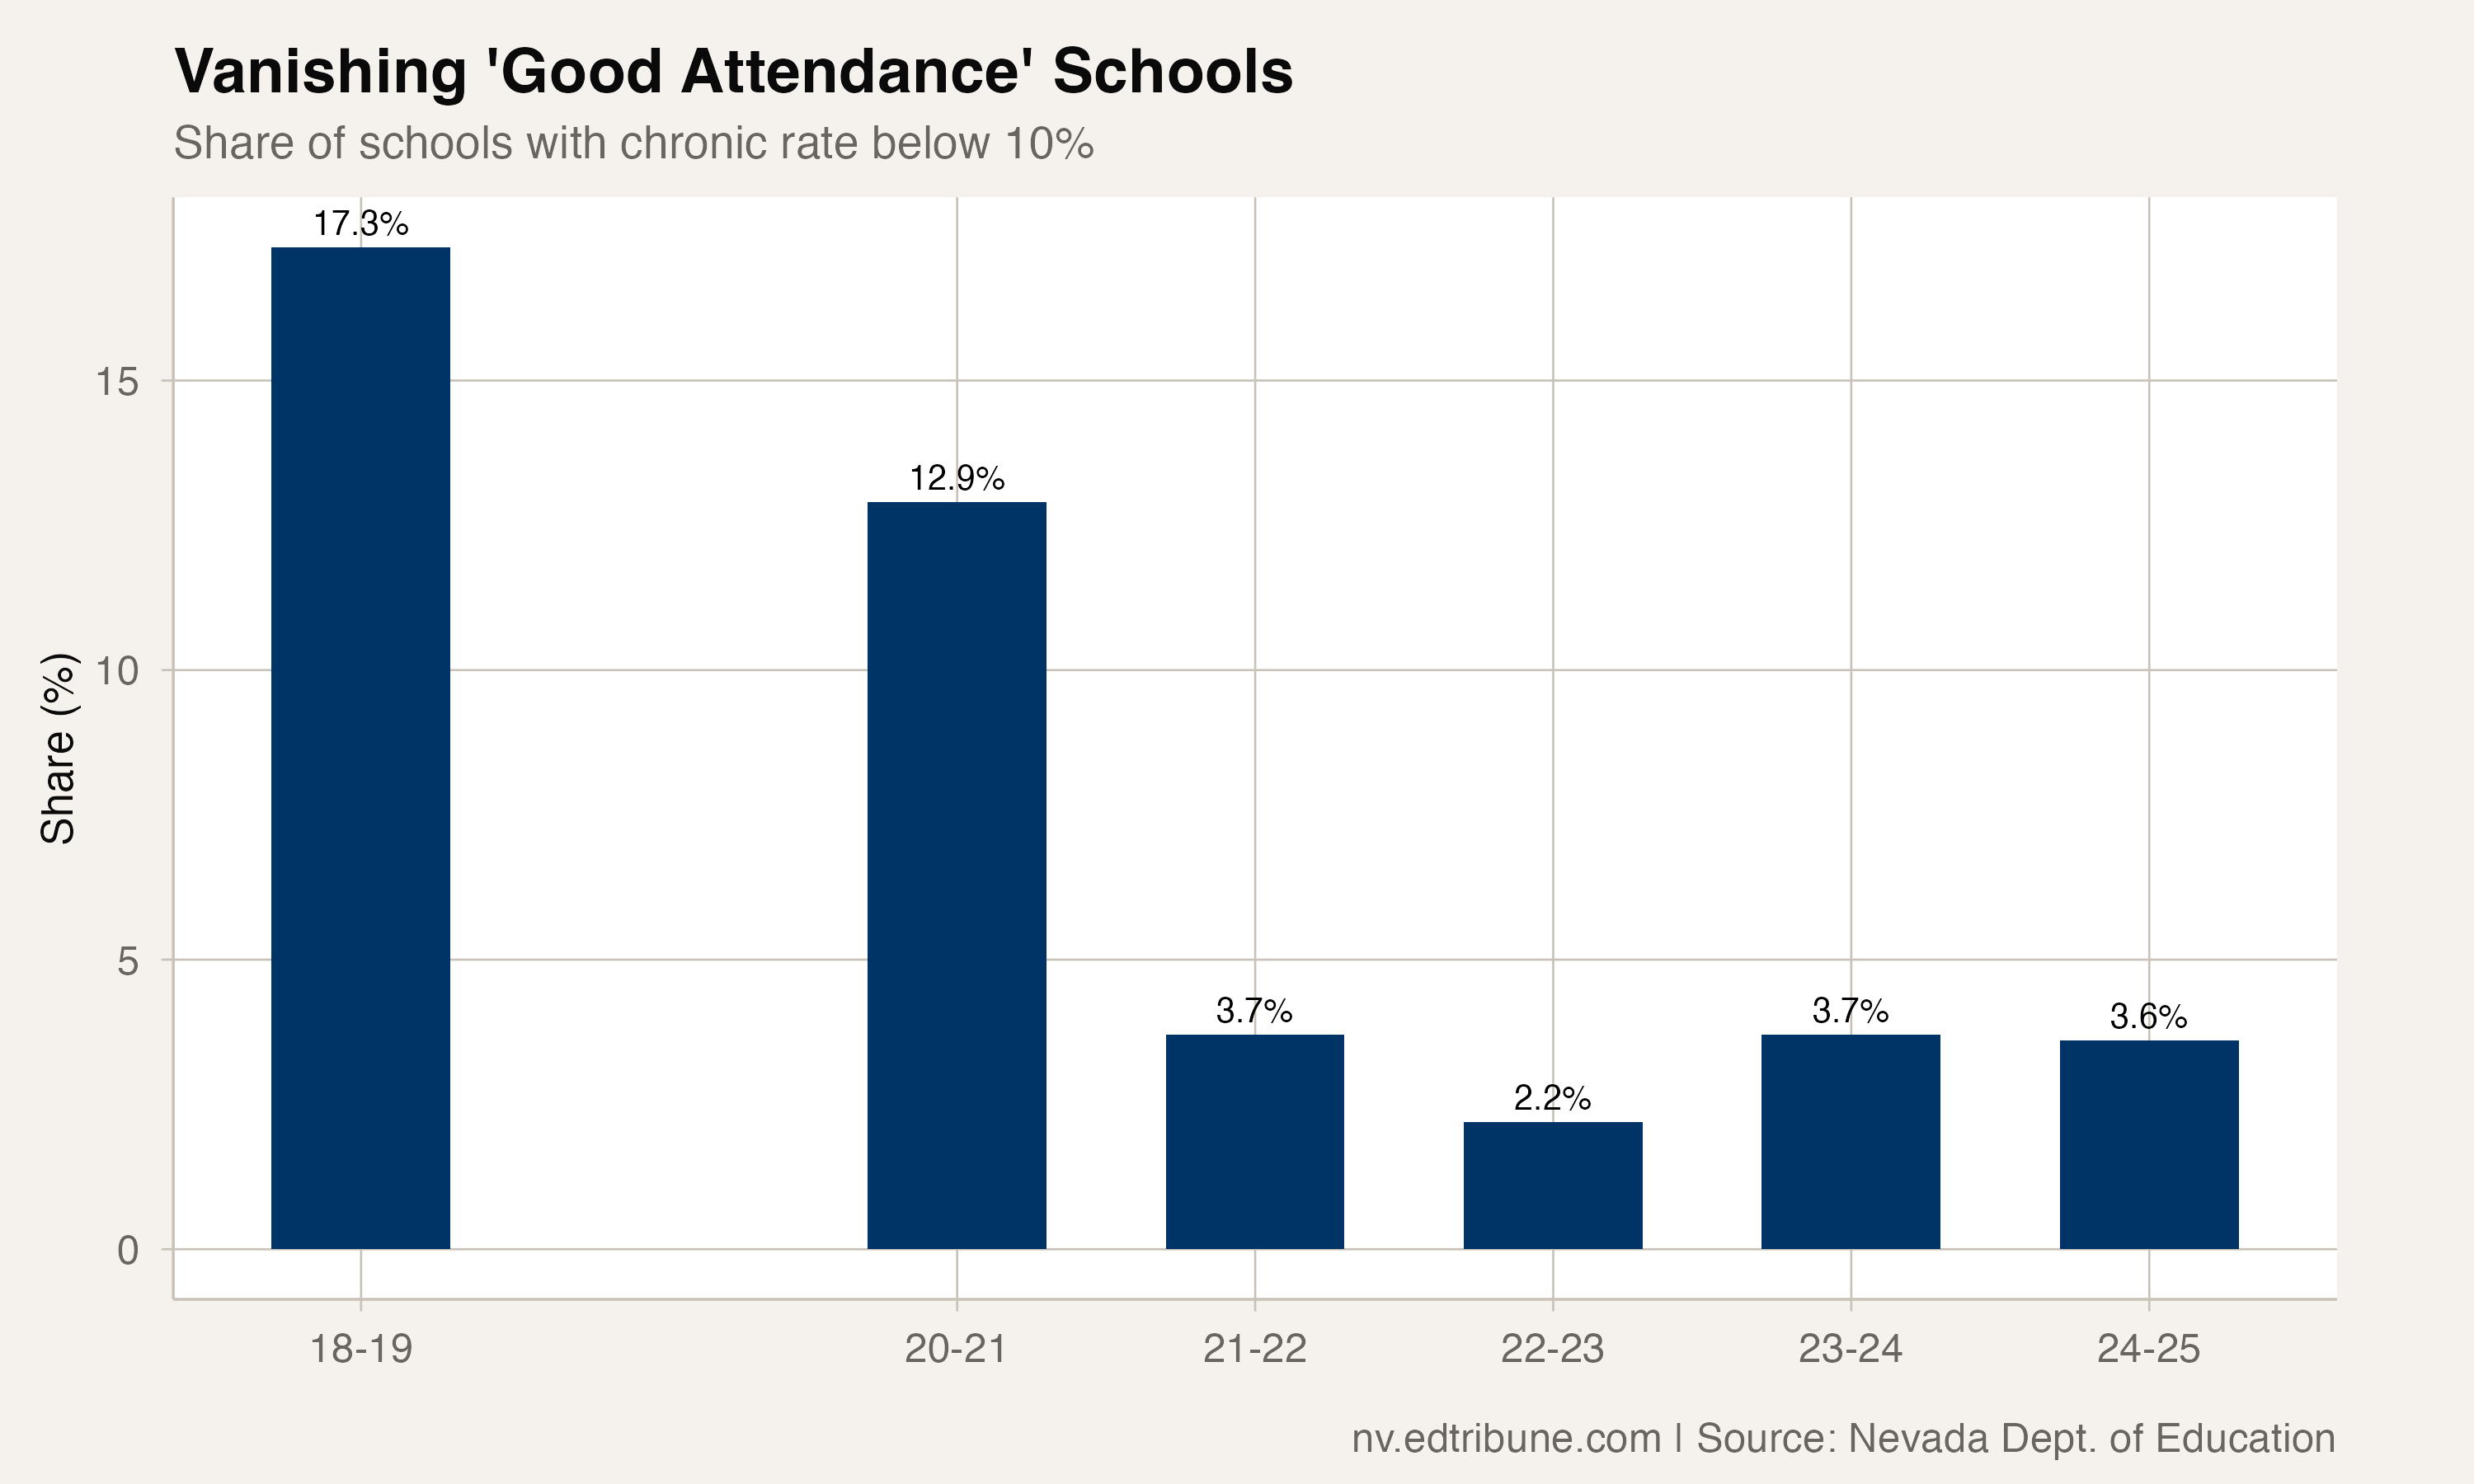
The below-10% share fell from 17.3% in 2018-19 to 12.9% in 2020-21 and 3.7% in 2021-22. It then measured 2.2%, 3.7% and 3.6% in the next three years. Every value from 2021-22 through 2024-25 was below 4%.
Closer to 2021-22 than to baseline
Using the five rate-band shares as a distribution, the total-variation distance between 2024-25 and 2021-22 was 12.4 percentage points. The distance between 2024-25 and 2018-19 was 38.8 points. By that explicit measure, the current distribution was closer to 2021-22 than to the pre-pandemic baseline.
Detailed code that reproduces the analysis and figures in this article is available exclusively to EdTribune subscribers.
Discussion
Sign in to join the discussion.
Loading comments...