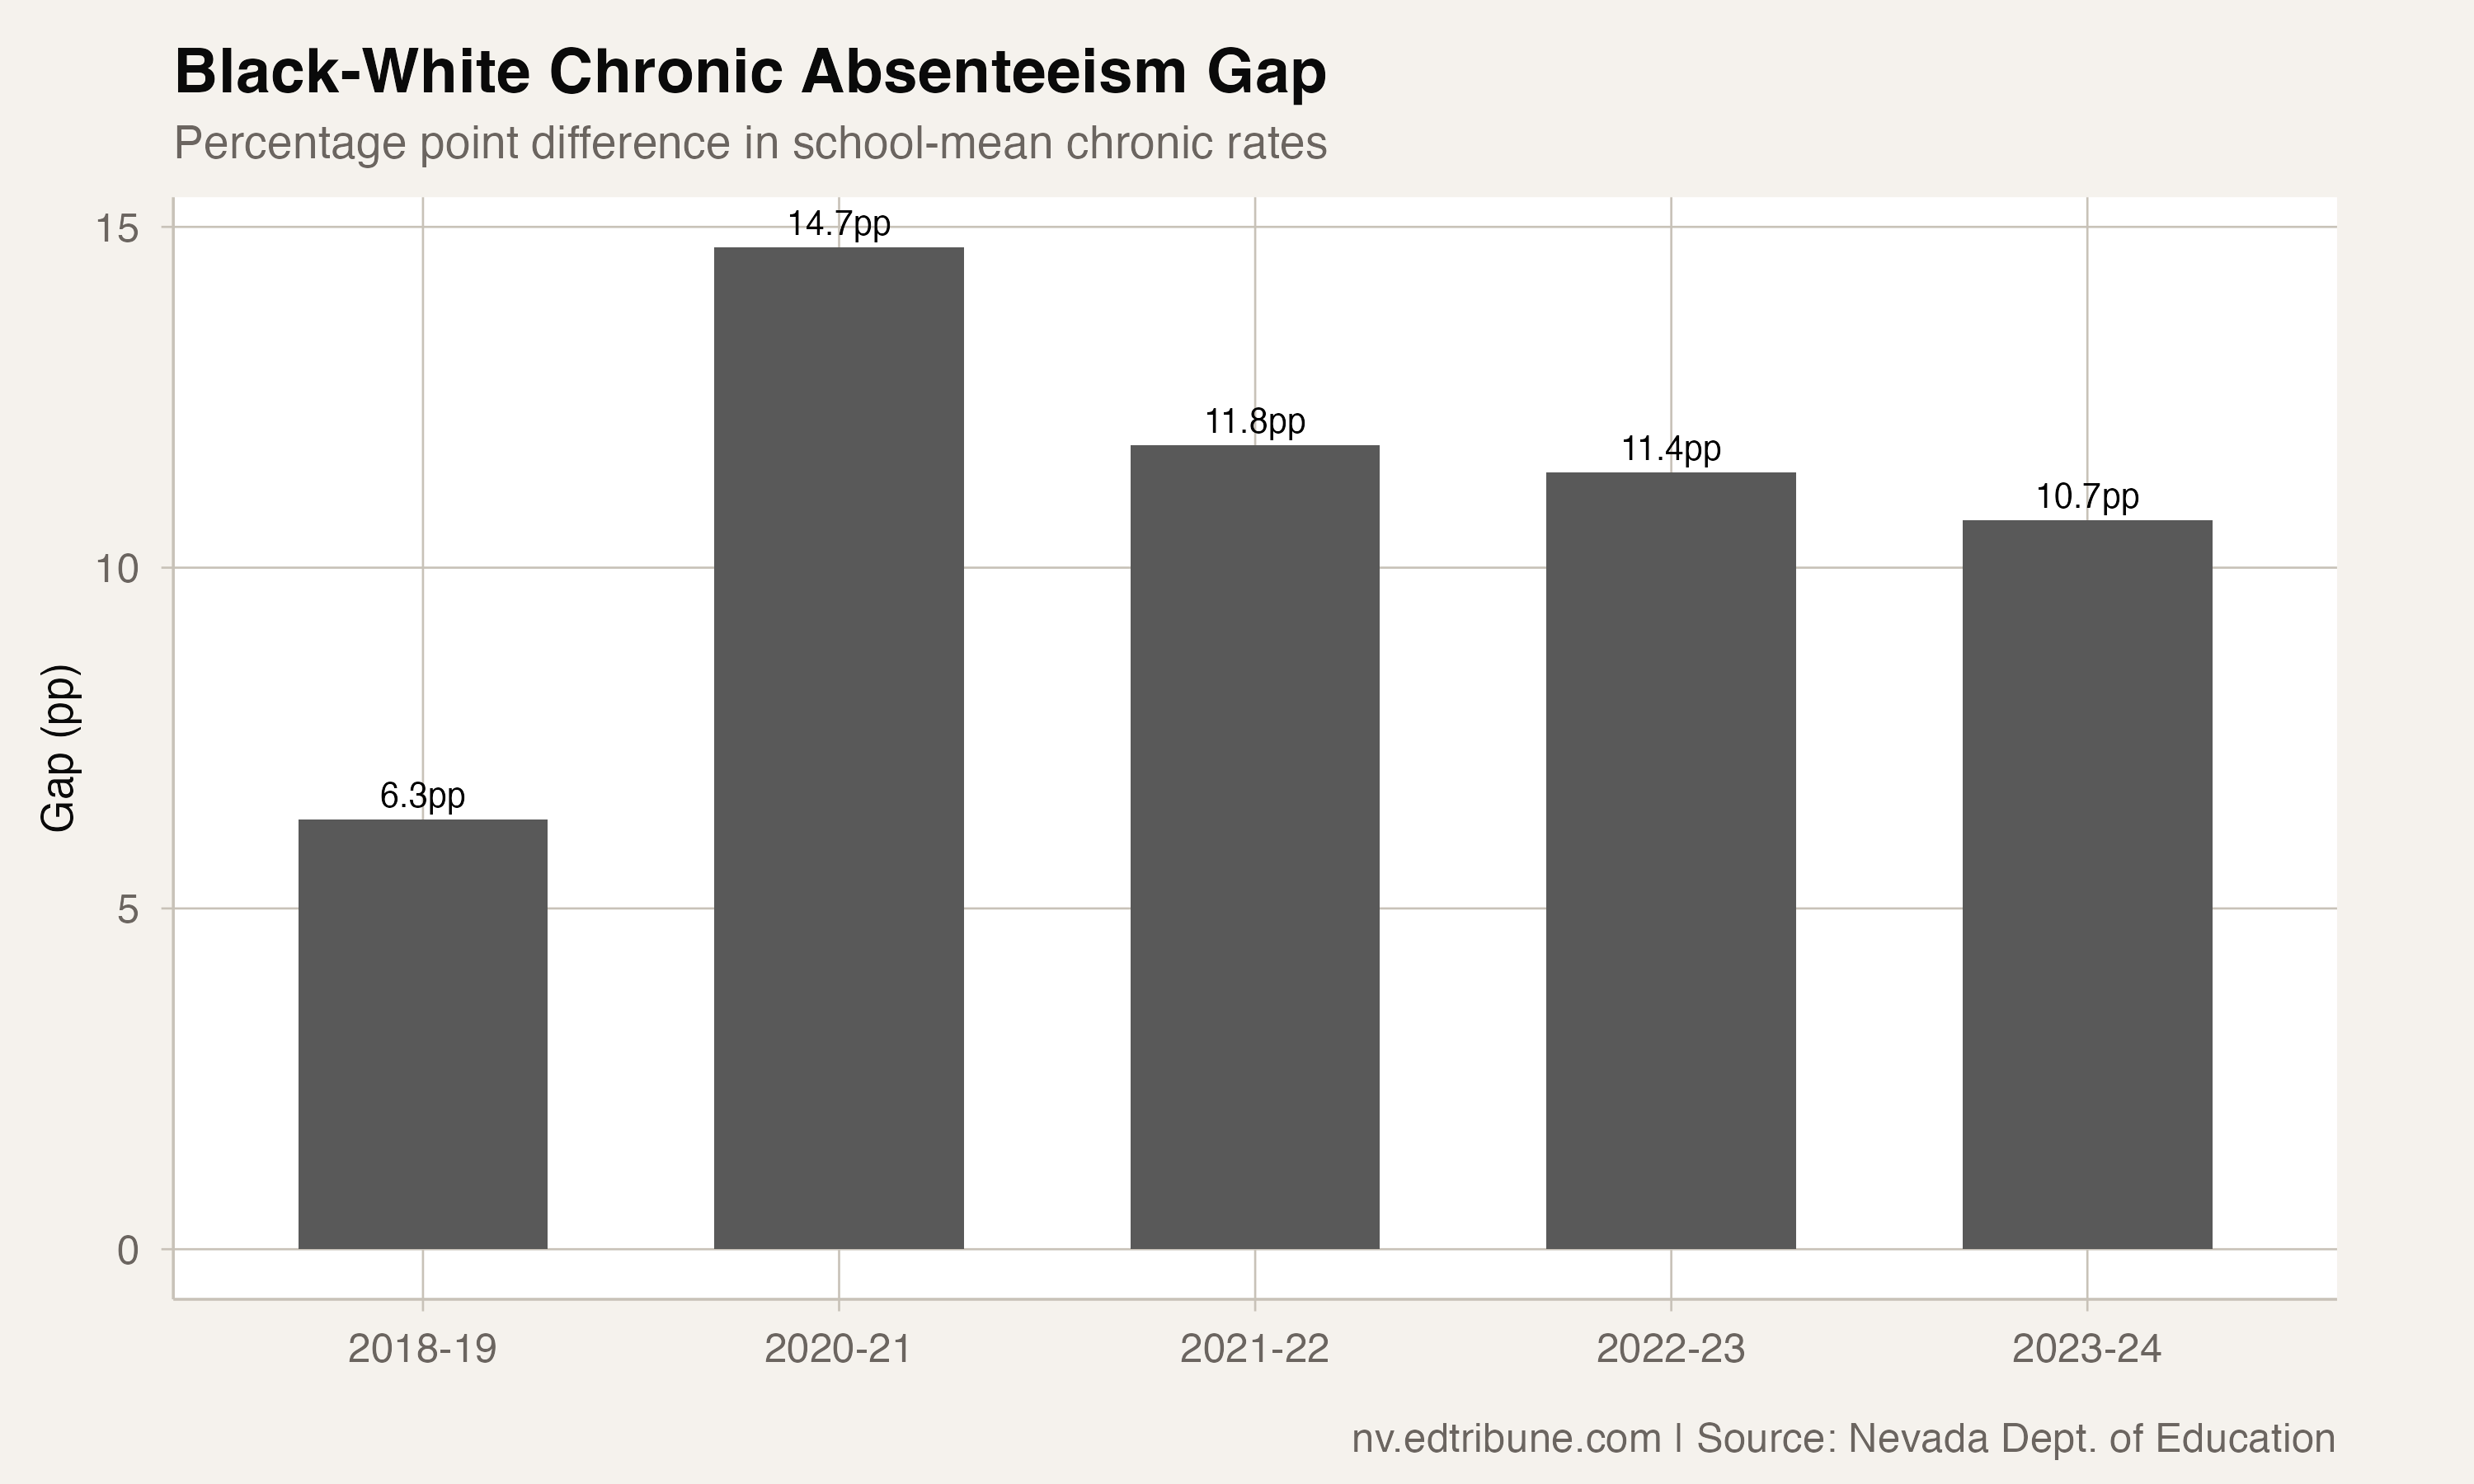
Before the pandemic, the chronic absenteeism gap between Black and white students in Nevada was 6.3 percentage points. By 2023-24, it had grown to 10.7 points, nearly 70% larger. Black students' school-mean chronic rate of 37.8% means that at the average Nevada school reporting this subgroup, more than one in three Black students is missing at least 10% of the school year.
The gap did not widen steadily. It exploded to 14.7 percentage points in 2020-21, the first full pandemic school year, before narrowing gradually. But five years later, the gap remains substantially wider than its pre-COVID level, and the rates for both groups remain deeply elevated.
The gap in numbers
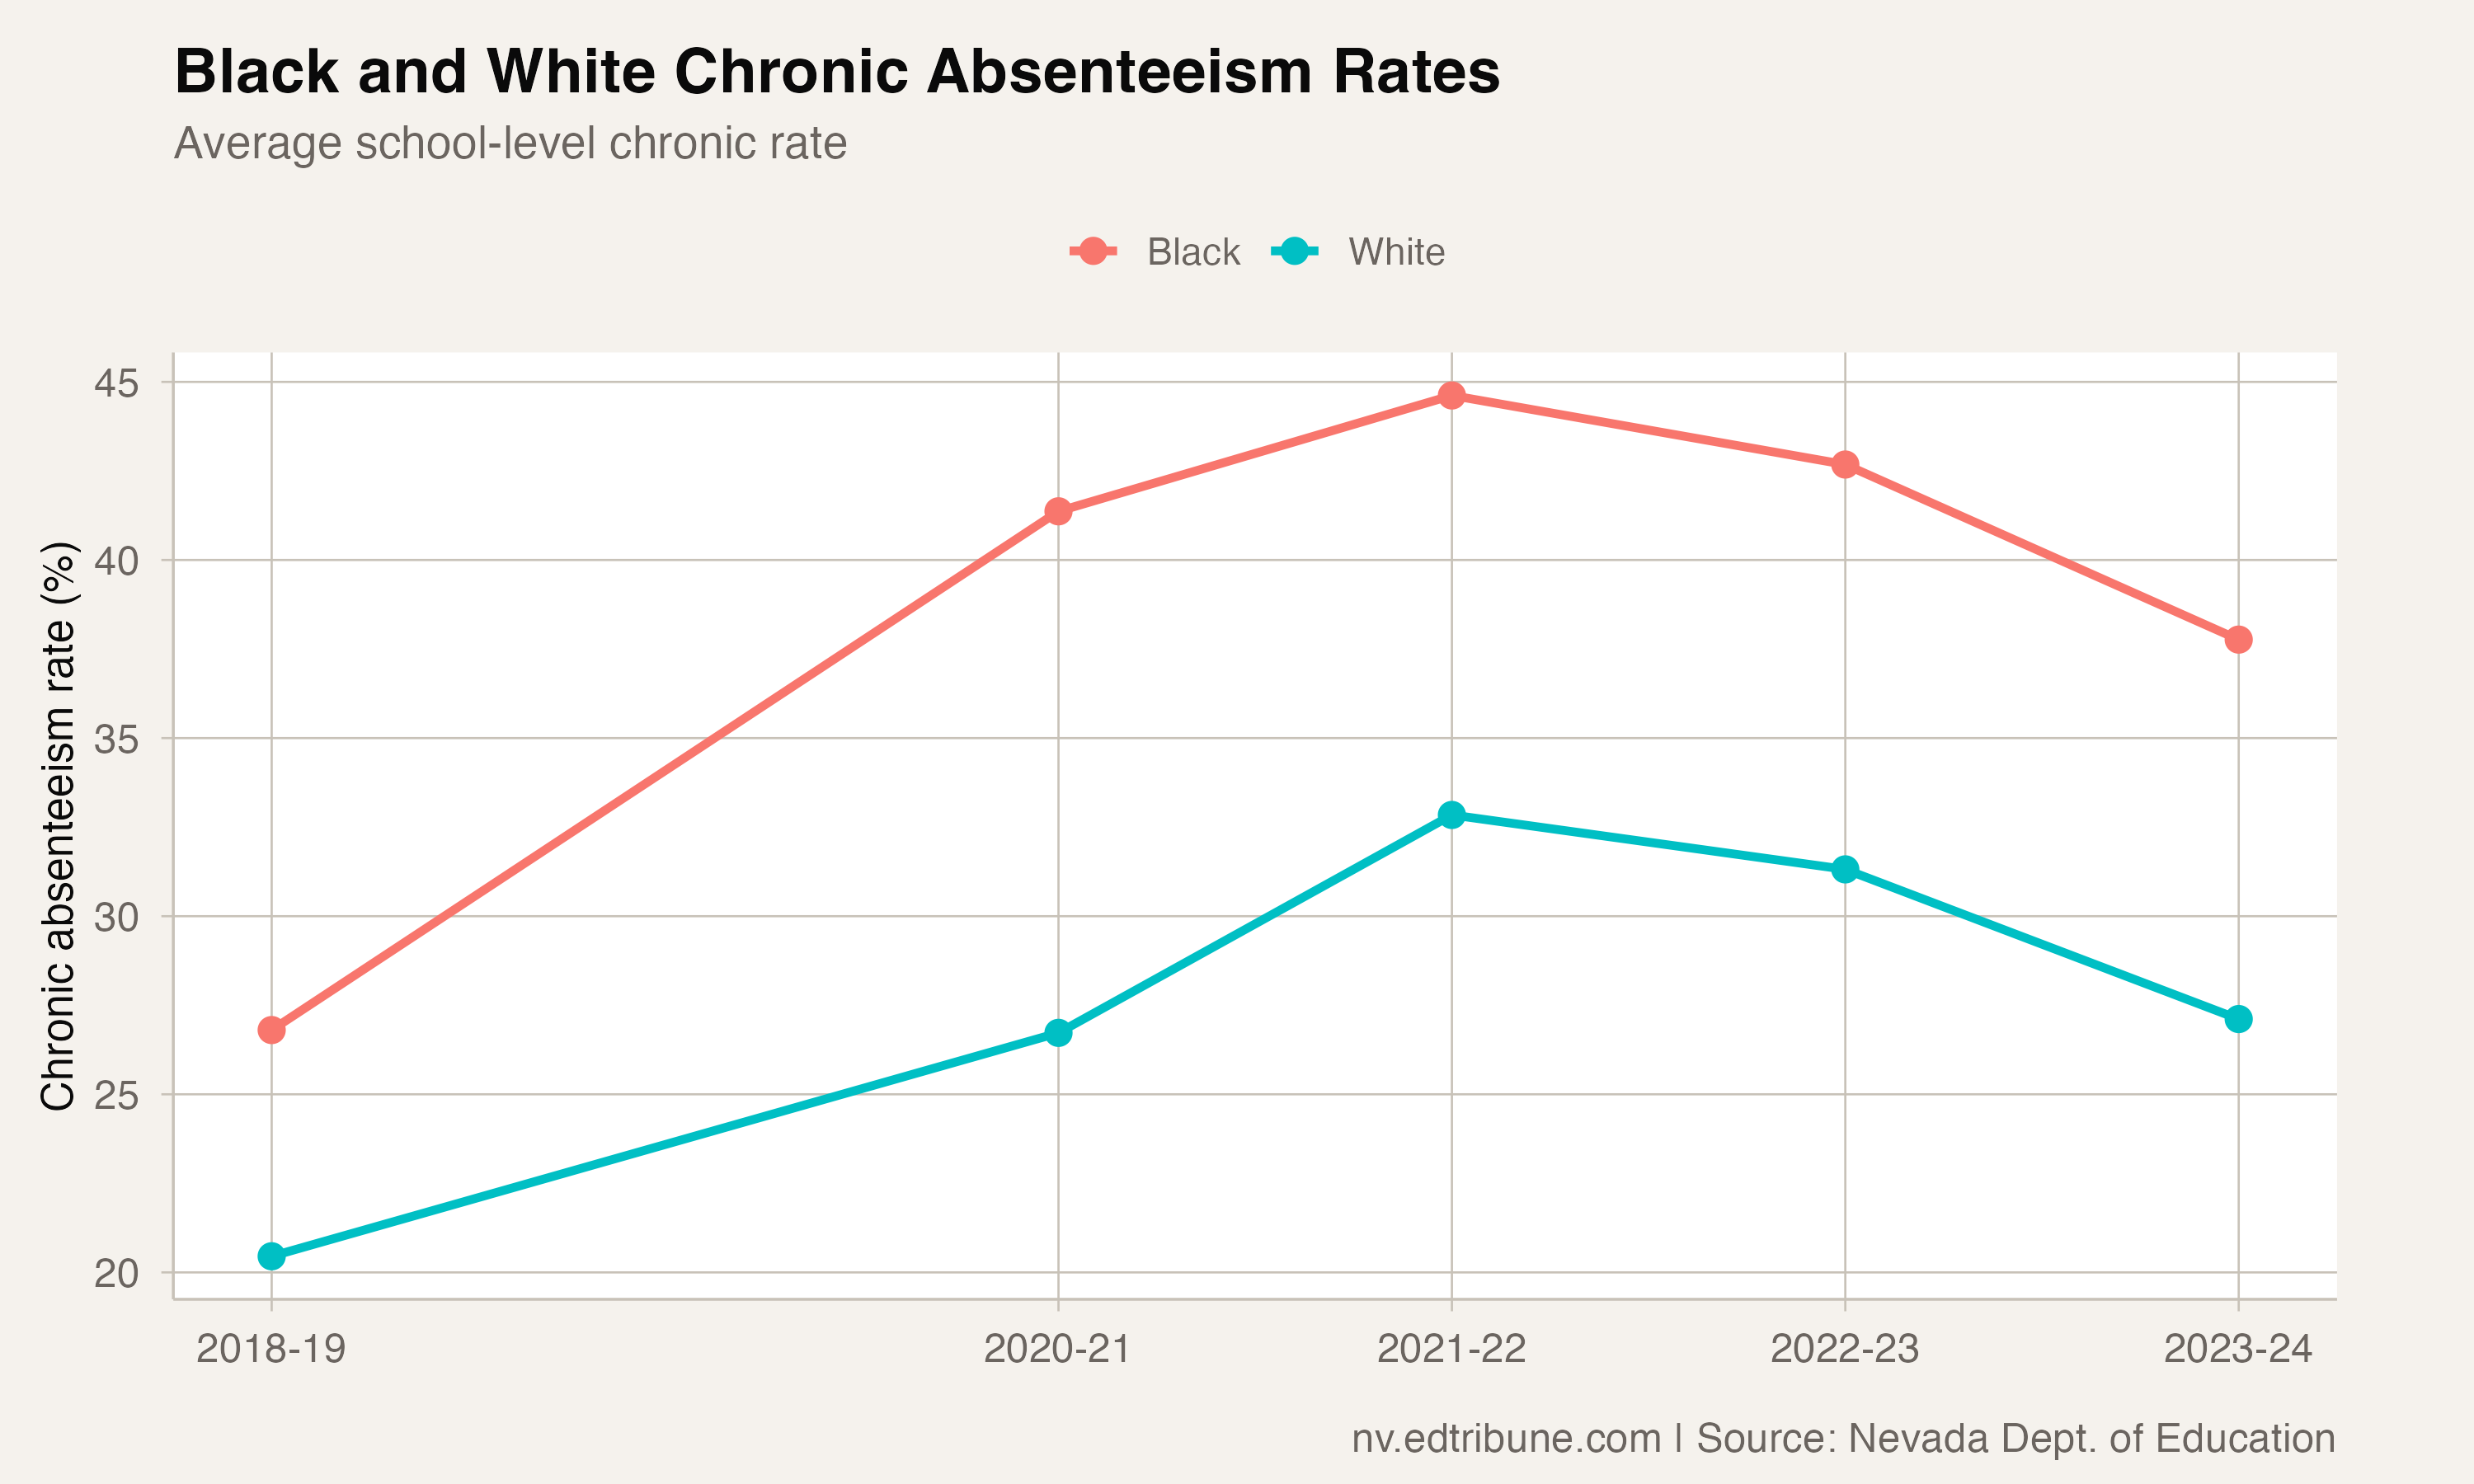
In 2018-19, Black students averaged 26.8% chronic absenteeism across 447 schools, while white students averaged 20.5% across 565 schools. The 6.3-point gap was concerning but modest by national standards.
COVID changed the math. By 2020-21, Black students surged to 41.4% while white students climbed to 26.7%, a gap of 14.7 points. Black students peaked at 44.6% in 2021-22, white students at 32.8%. Both groups have improved since, but Black students' recovery has slightly lagged: the Black rate dropped 6.8 points from peak while the white rate dropped 5.7 points. That asymmetry keeps the gap stubbornly wide.
The full spectrum
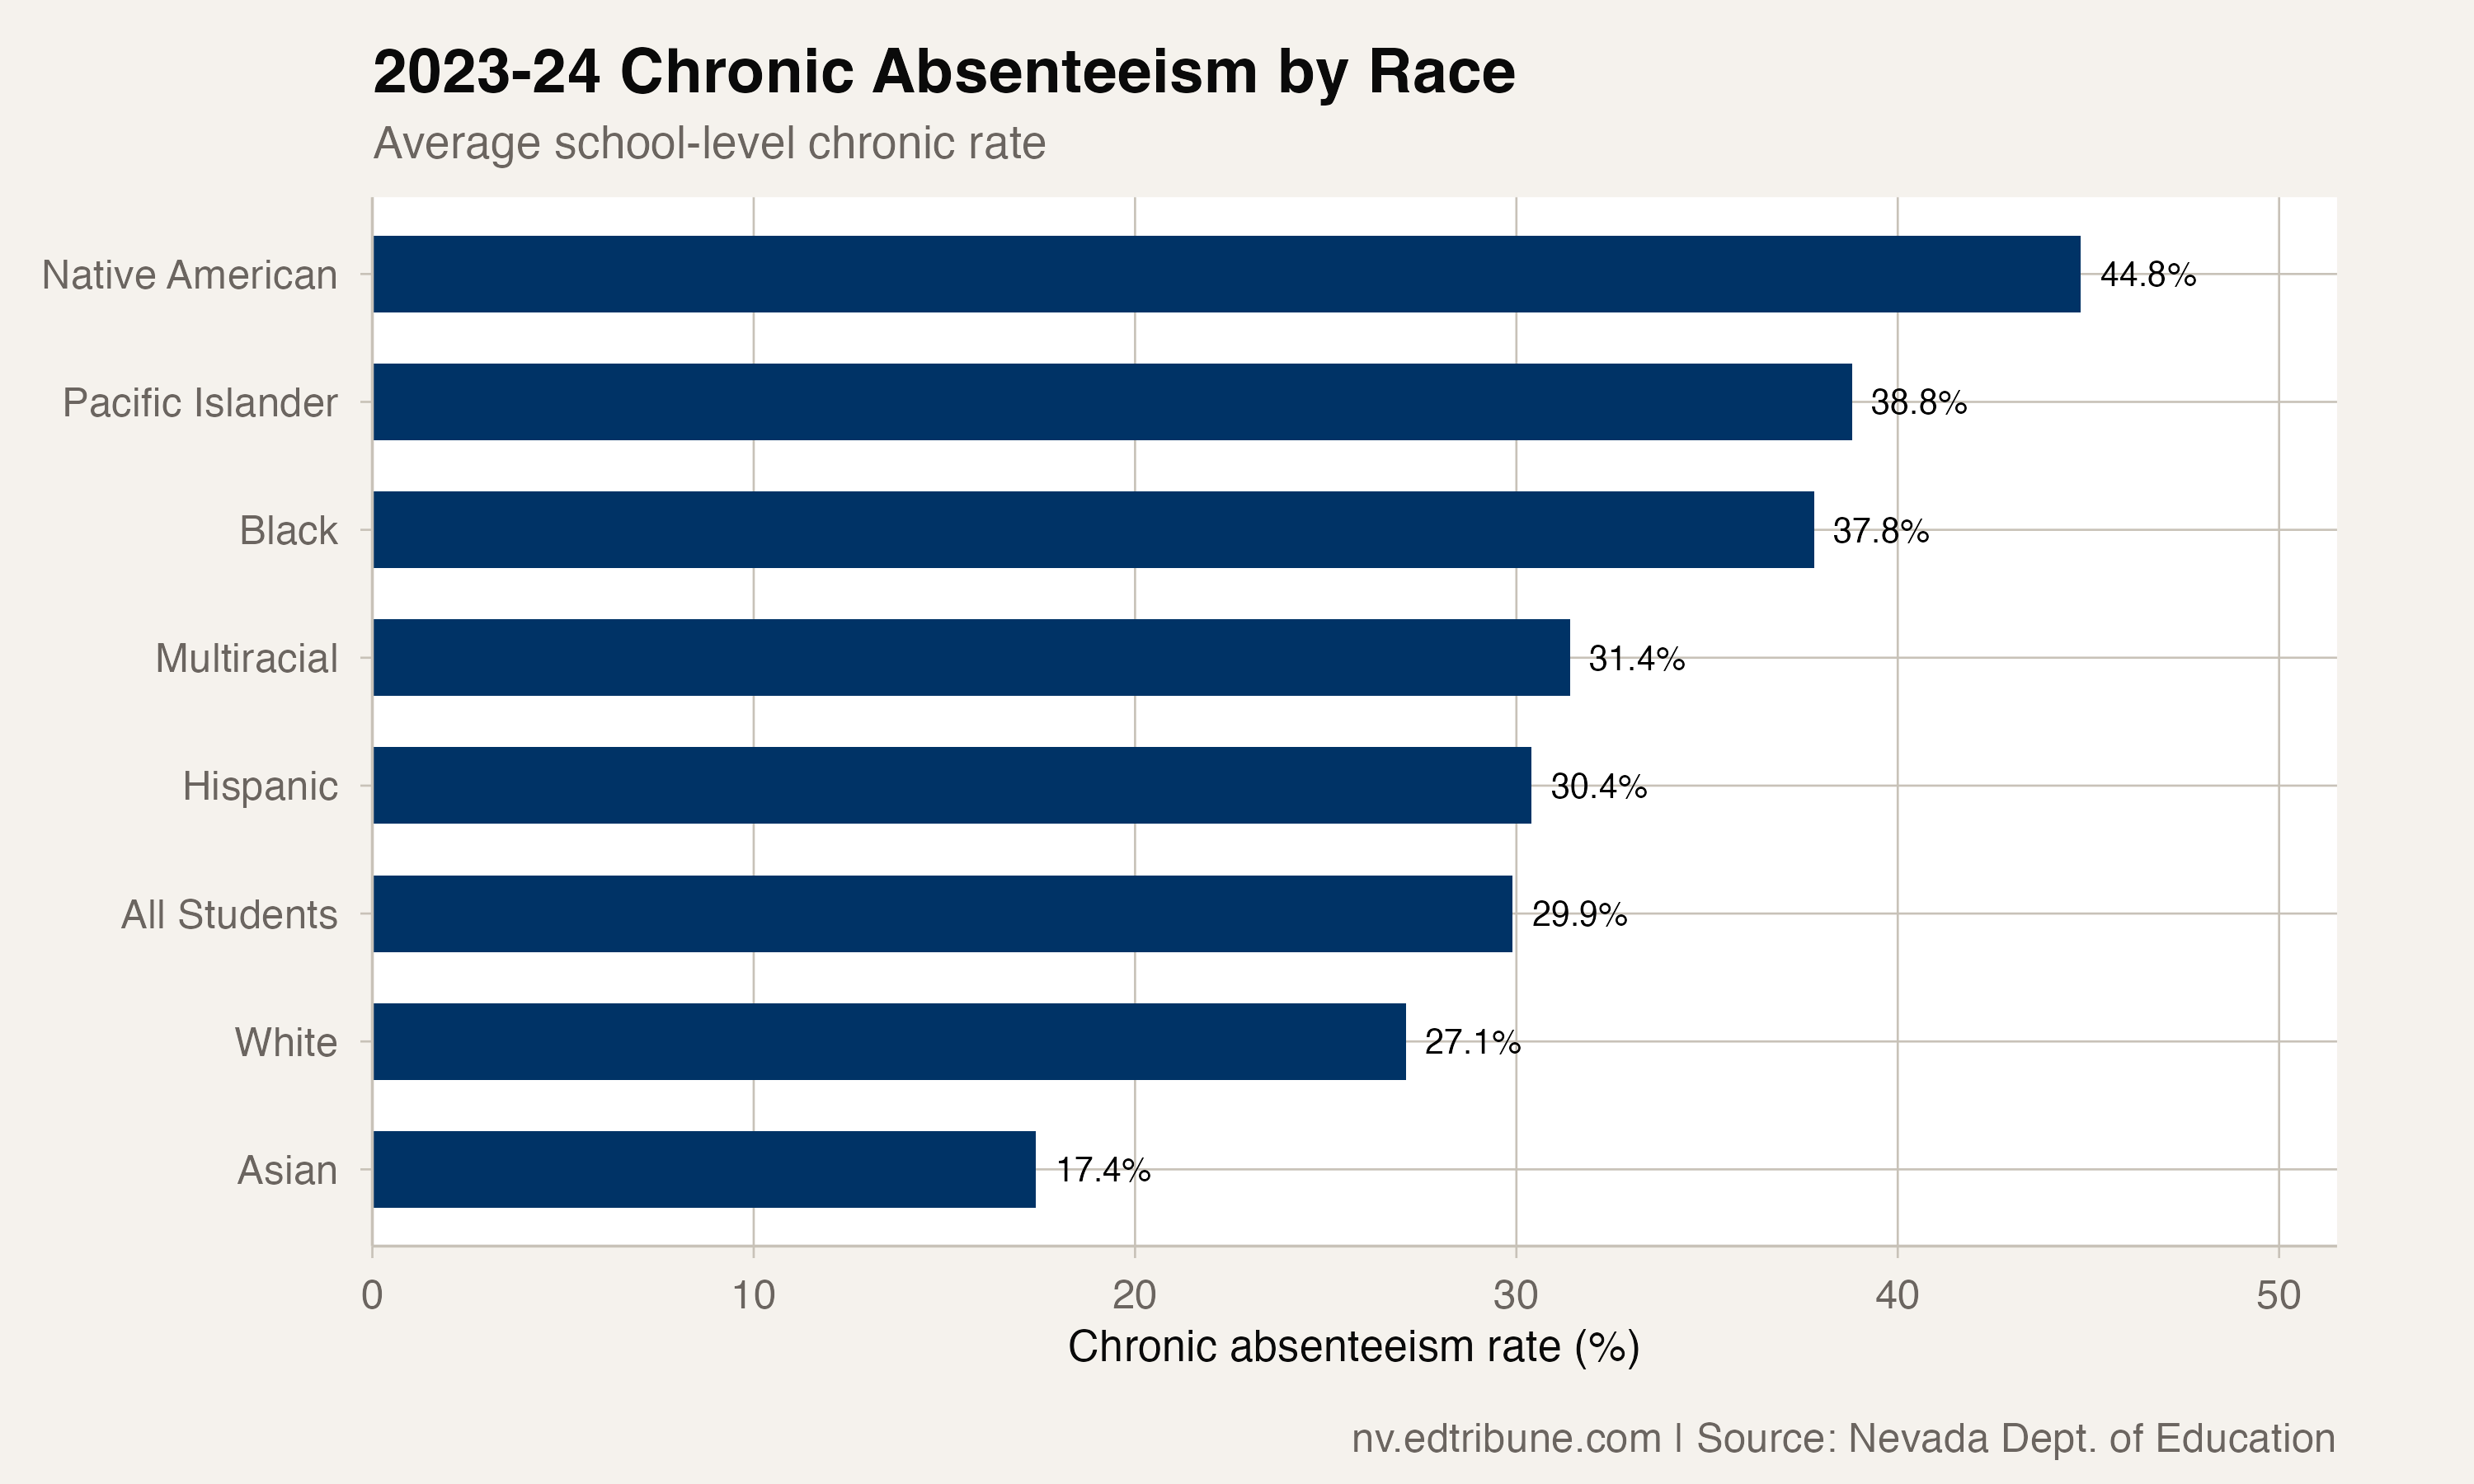
The Black-white gap does not exist in isolation. Native American students face the highest chronic rate of any group at 44.8%, followed by Pacific Islander students at 38.8%. Black students rank third at 37.8%. Hispanic students (30.4%) fall close to the all-student average of 29.9%, while Asian students have the lowest rate at 17.4%.
The spread from Asian to Native American is a staggering 27.4 percentage points. A randomly selected school reporting both subgroups would show nearly three times the chronic absenteeism rate among its Native American students compared to its Asian students.
What the gap reflects
Chronic absenteeism gaps by race are not simply race gaps. They are composites of income gaps, housing stability gaps, transportation gaps, and healthcare access gaps that correlate with race in well-documented ways. In Clark County↗ET, where the vast majority of Nevada's Black students attend school, many Black families live in neighborhoods east of the Las Vegas Strip and in North Las Vegas, areas with higher poverty rates, fewer healthcare providers, and longer bus rides to school.
The overlap with economic disadvantage is notable. The state-reported chronic rate for students eligible for free or reduced-price lunch was 31.5% in 2023-24, close to the 37.8% rate for Black students. This suggests that economic disadvantage explains a substantial portion of the racial gap, though not all of it.
Nevada ranks 51st nationally for youth mental health access, and Black youth nationally are less likely to receive mental health services than white peers, according to the Substance Abuse and Mental Health Services Administration. In a state where mental health infrastructure is already thinnest in the nation, the disparate impact falls hardest on communities with the fewest alternatives.
The narrowing that is not enough
There is genuine progress in the numbers. The gap peaked at 14.7 points in 2020-21 and has narrowed to 10.7 by 2023-24. Both Black and white chronic rates have declined from their peaks. These improvements are real.
But measuring progress against the pandemic peak sets the bar too low. The relevant question is whether Nevada is closing the pre-pandemic gap or whether COVID permanently widened it. At 10.7 points versus a pre-COVID 6.3, the answer so far is that the pandemic gap has become the new gap.
The 2024-25 racial subgroup data is excluded from this analysis due to a methodology break in how schools report subgroup information. When clean 2025 data becomes available, it will show whether the narrowing trend continued or, like the statewide reversal, bent the wrong way.
Detailed code that reproduces the analysis and figures in this article is available exclusively to EdTribune subscribers.
Discussion
Sign in to join the discussion.
Loading comments...