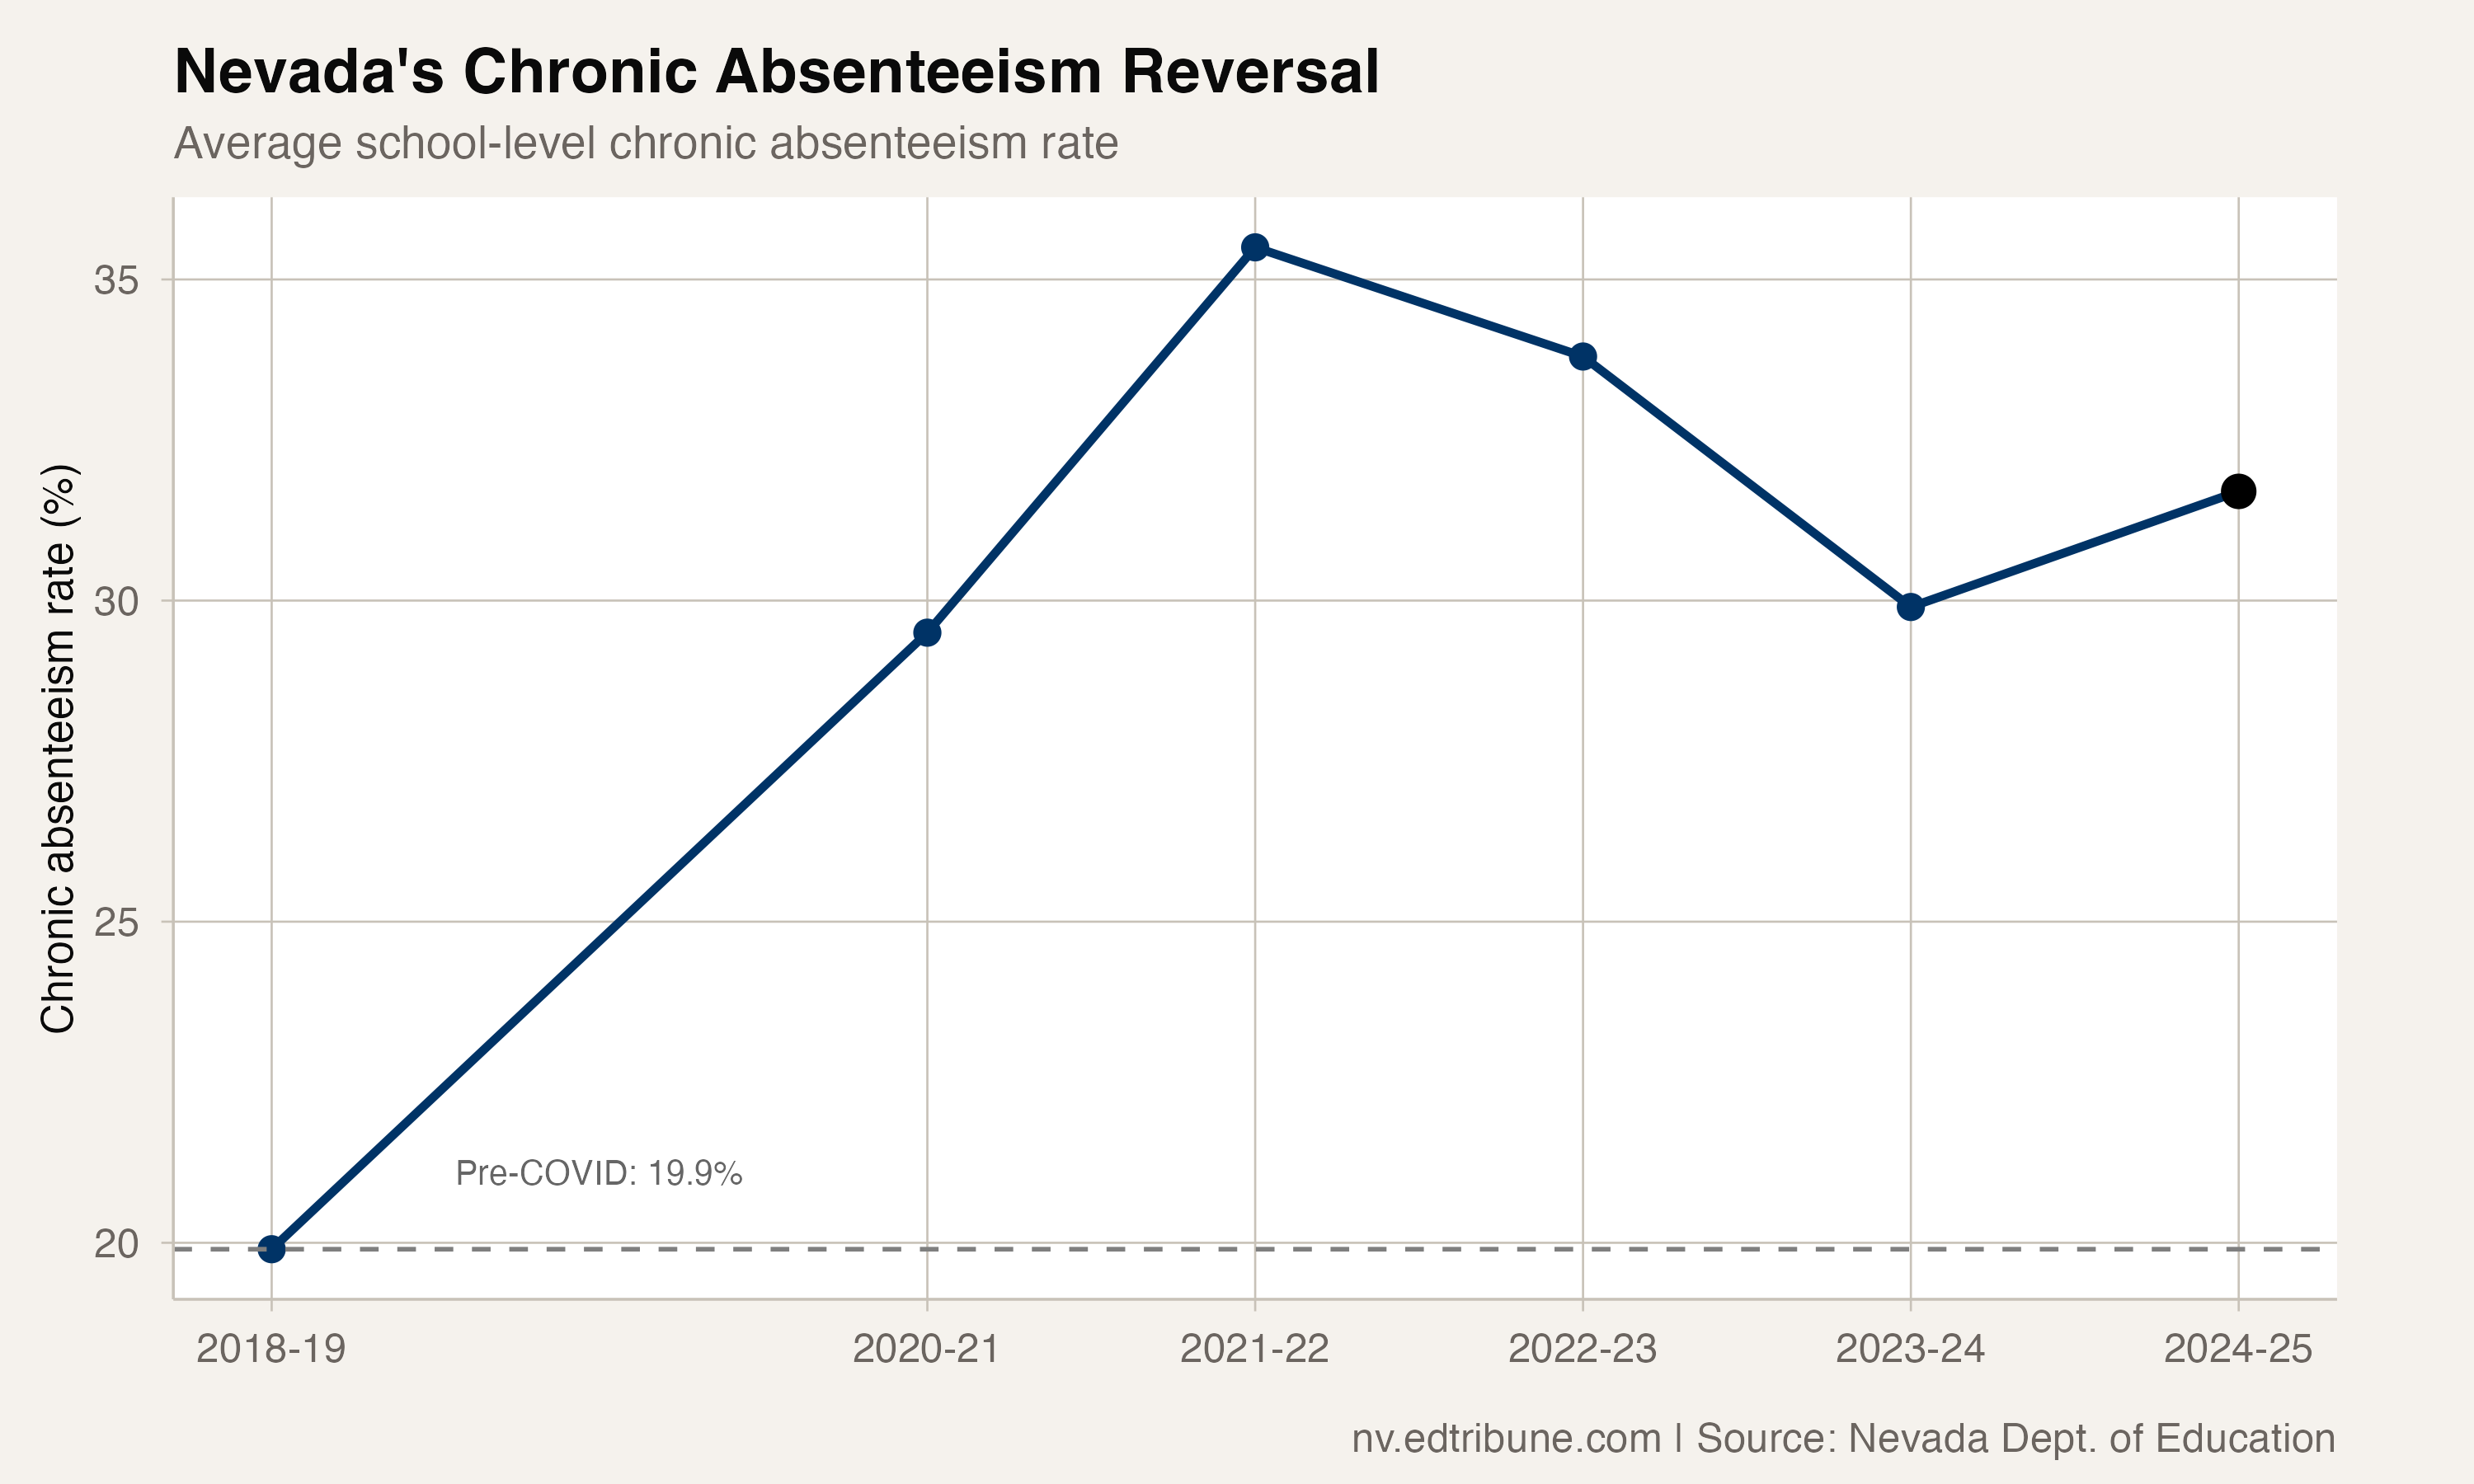
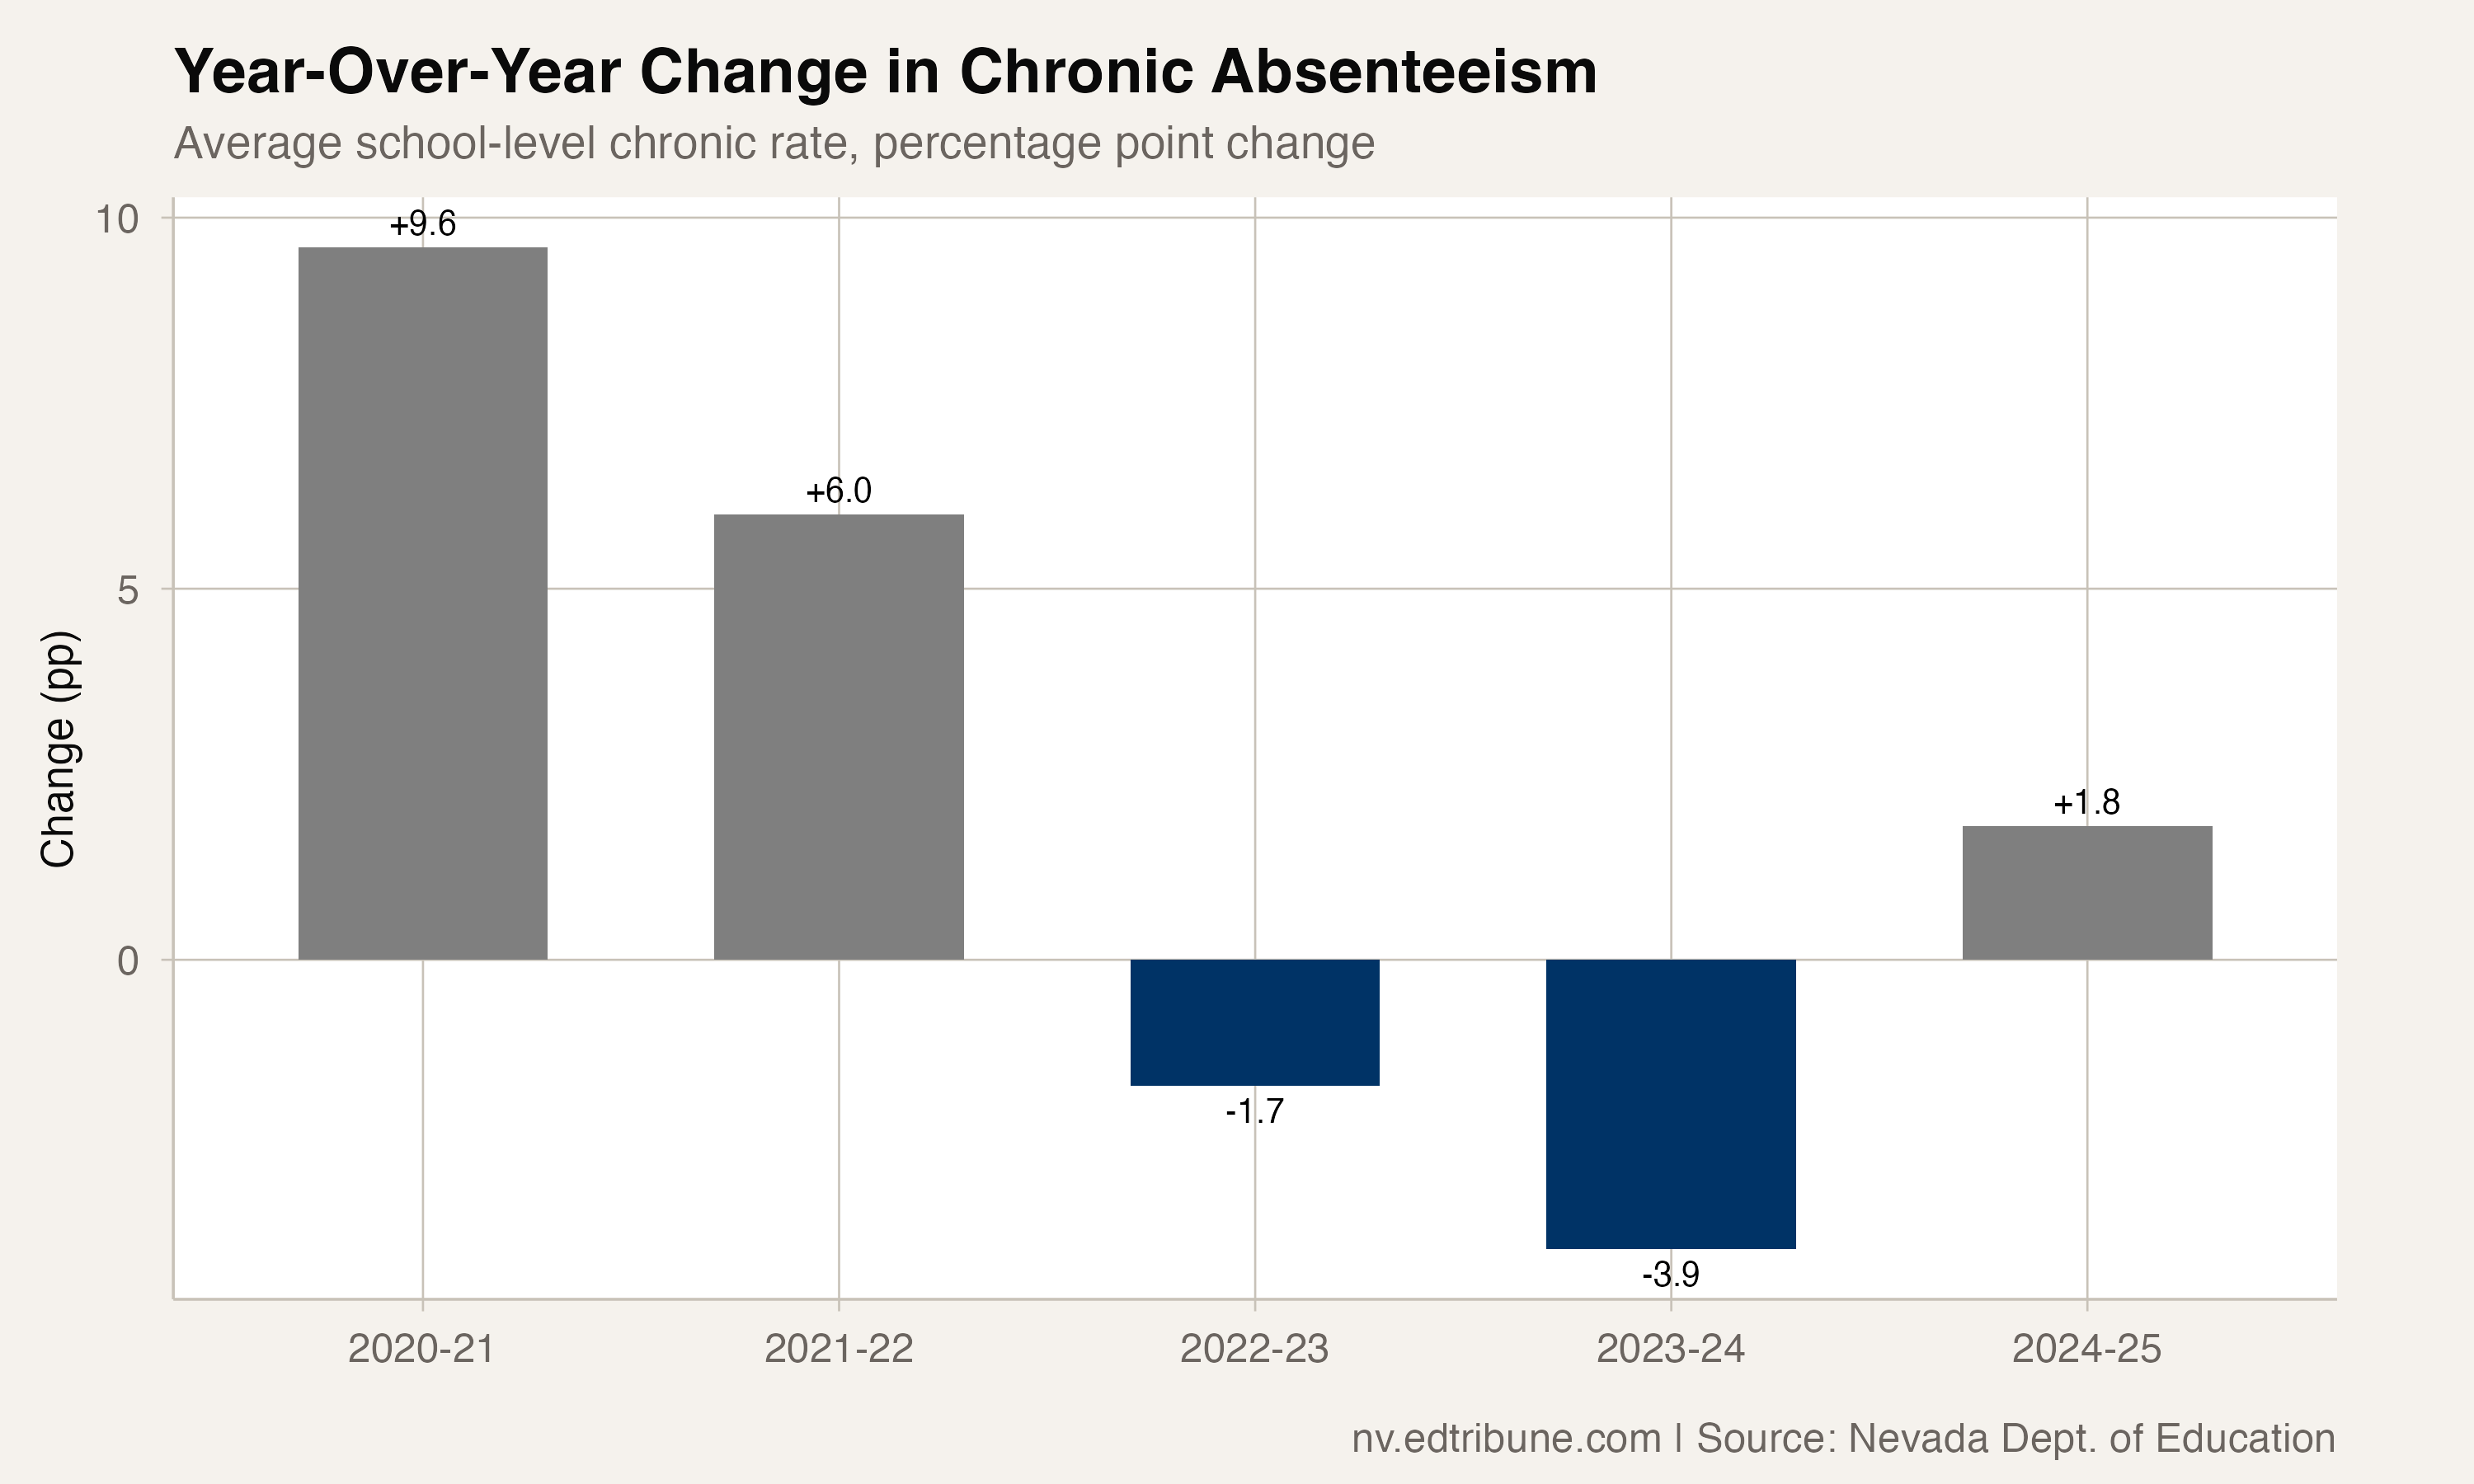
Two years of progress vanished in a single school year. Nevada's average school-level chronic absenteeism rate climbed from 29.9% to 31.7% in 2024-25, a 1.8 percentage point reversal that erased nearly half of the previous year's improvement. Thirteen of the state's 17 traditional districts saw their rates worsen.
The reversal is especially painful because it came after what appeared to be a real turning point. From the 2021-22 peak of 35.5%, Nevada had clawed back 5.6 percentage points over two years, the kind of sustained decline that suggested the pandemic-era attendance crisis was finally loosening its grip. The 2025 data says otherwise.
The reversal is broad, not isolated
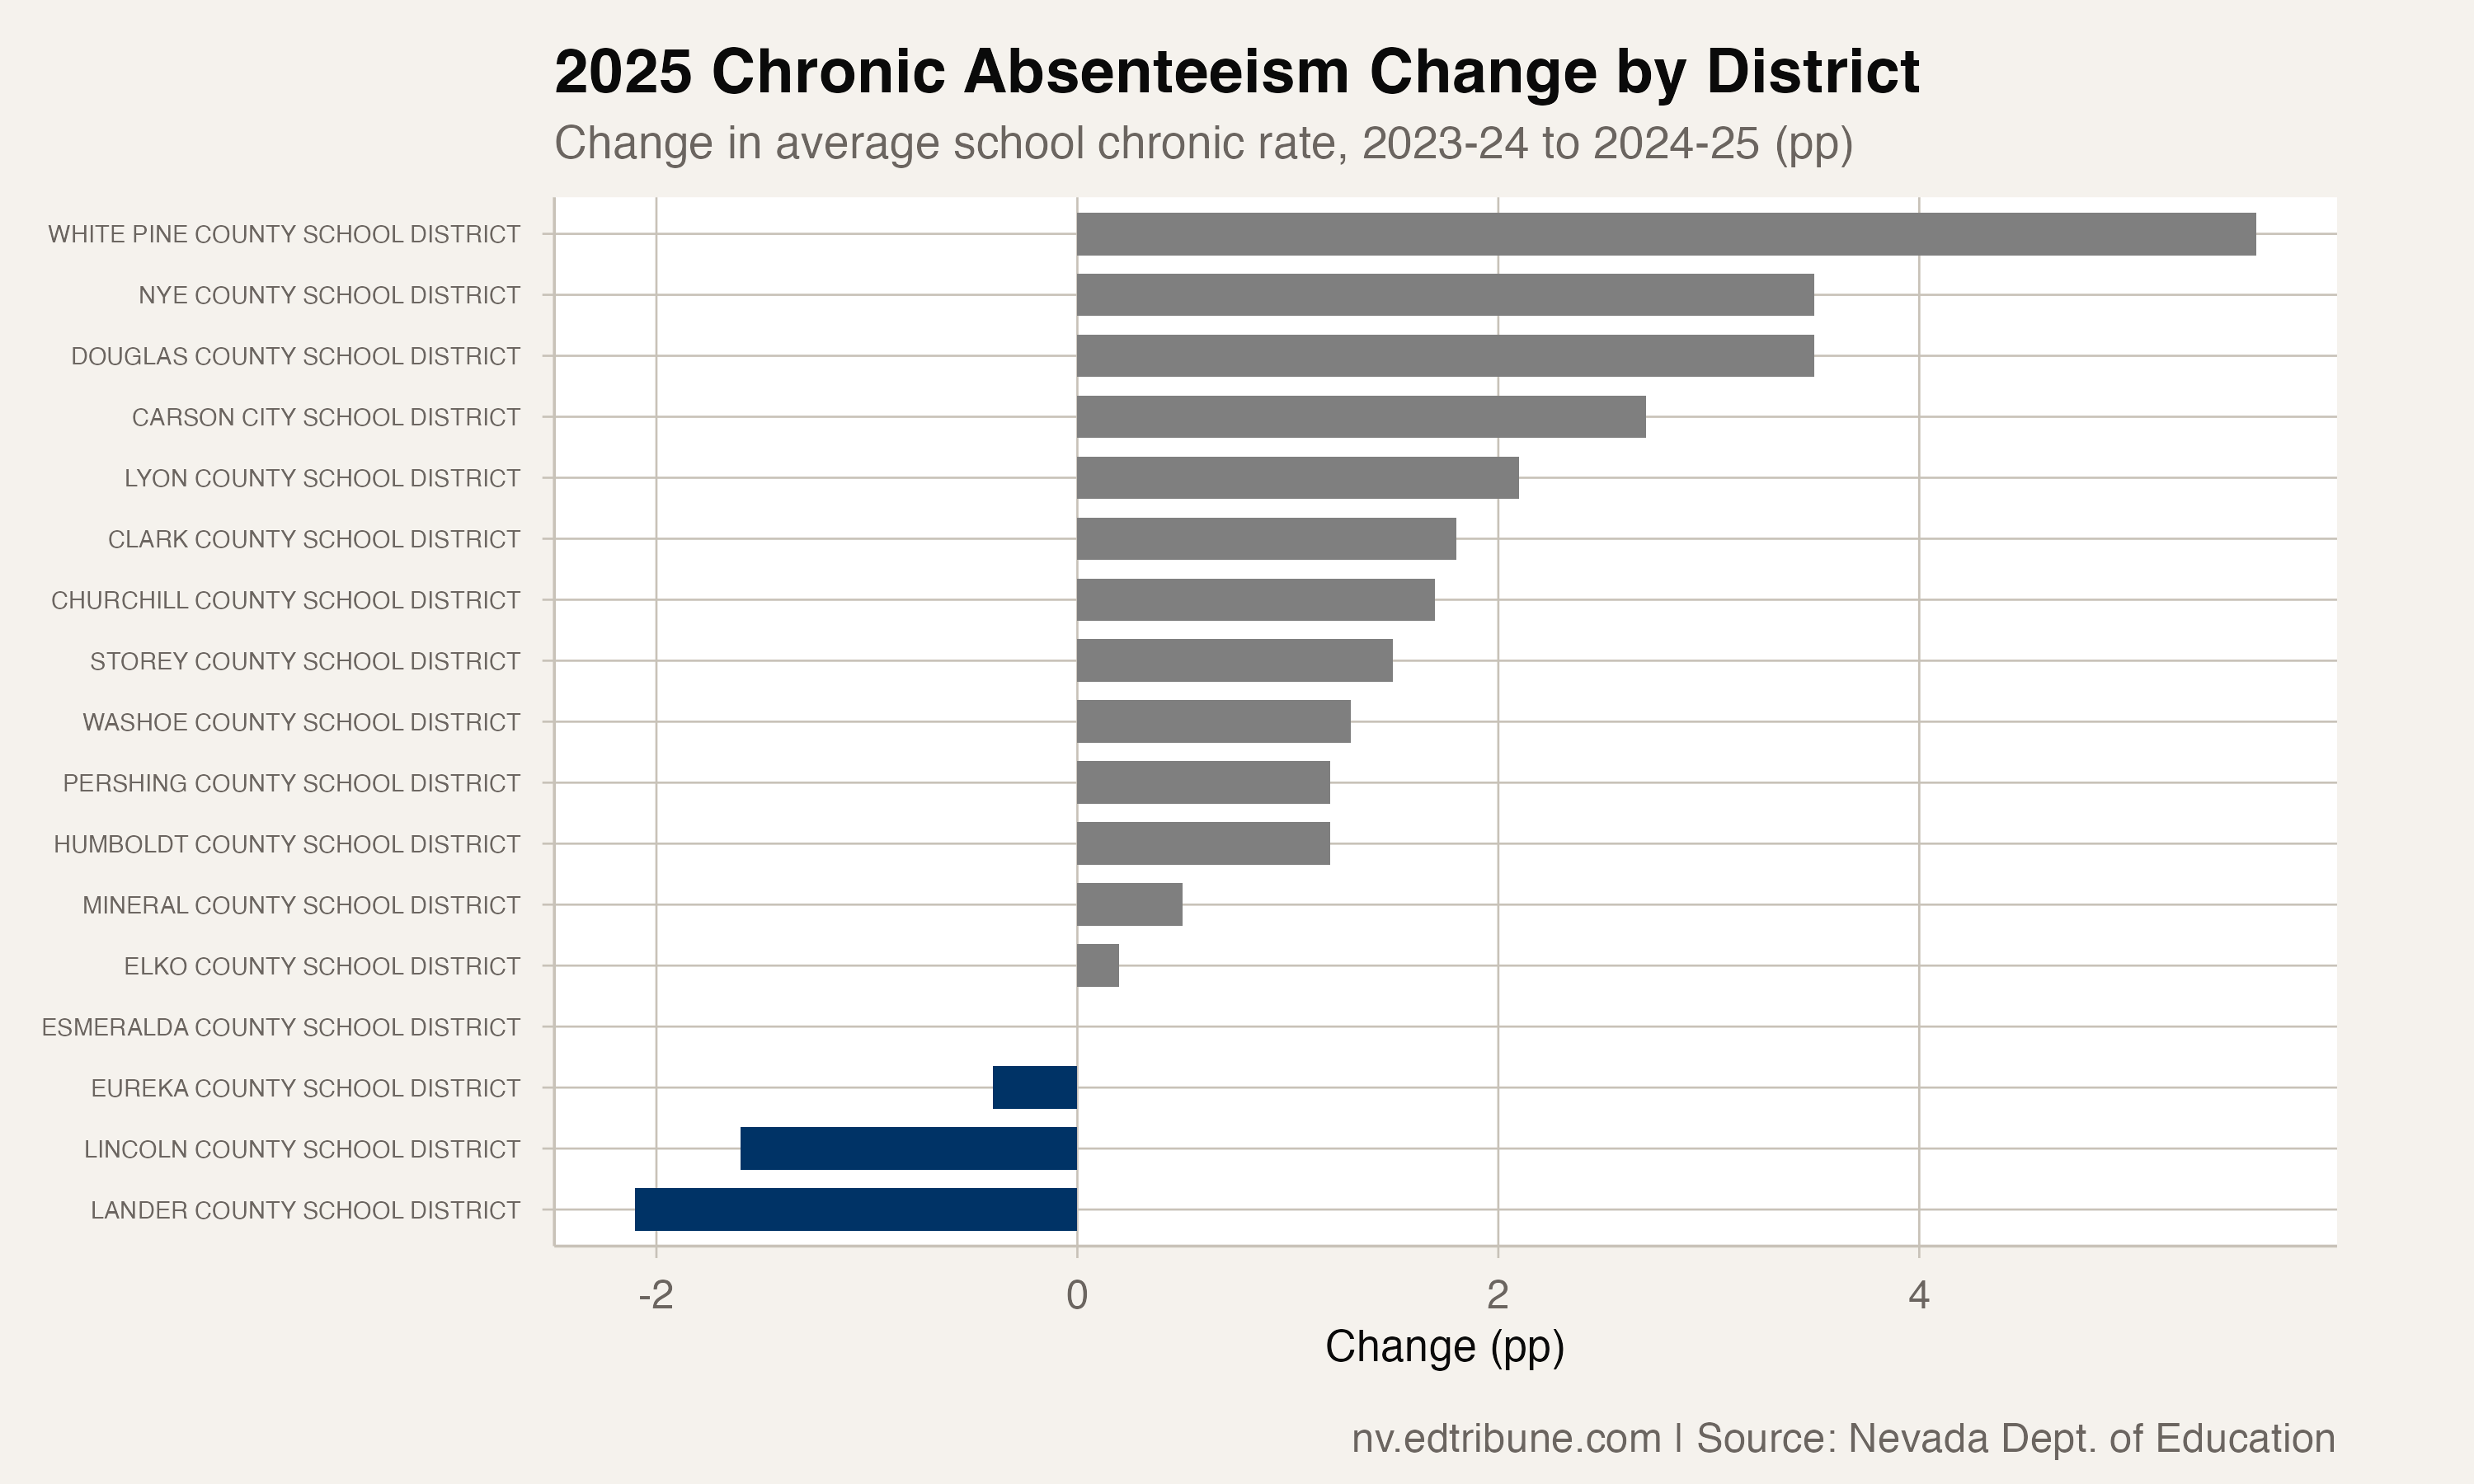
This is not a story about one struggling district dragging down the state average. The deterioration spans geography and size. White Pine County↗ET posted the largest single-year increase, surging 5.6 percentage points to 34.2% and wiping out three years of recovery. Douglas County↗ET and Nye County↗ET each worsened by 3.5 points. Even Clark County↗ET, whose dedicated absenteeism office conducted more than 20,000 home visits during the year, saw its school-level average rise from 31.5% to 33.3%.
Only four districts improved. Lander County↗ET dropped 2.1 points, Lincoln County↗ET fell 1.6, and Eureka County↗ET continued its quiet streak with a 0.4-point decline. Esmeralda County↗ET held flat.
How much ground has actually been recovered?
Not much. Nevada's school-level chronic rate stood at 19.9% before the pandemic. It peaked at 35.5% in 2021-22. The current rate of 31.7% means the state has recovered just 24.4% of the way back to its pre-COVID baseline, and that fraction just shrank.
The official state-reported rate for students eligible for free or reduced-price lunch tells a somewhat more encouraging story: 26.9% in 2025, down from a peak of 39.4% and within striking distance of the pre-COVID 23%. But this metric captures only one subgroup at the state level and may not reflect the broader reality that school-level averages reveal.
What changed?
The data does not explain why rates reversed, only that they did. Several possibilities overlap. Nevada ranks 51st nationally for youth mental health access, according to Mental Health America, and the post-pandemic behavioral health crisis has deepened, not receded. Applied Analysis, a Las Vegas research firm, projects that unaddressed chronic absenteeism could cost Southern Nevada $14.4 billion over the next 20 graduating classes in lost earnings and reduced economic output.
Transportation barriers persist in rural districts where worsening was sharpest. White Pine County, where rates surged the most, is an isolated eastern Nevada community where some families live more than an hour from the nearest school. Douglas and Lyon counties face similar geography.
The reversal also coincides with the first full school year under Nevada's Pupil-Centered Funding Plan, which allocates dollars based on enrollment rather than attendance. Districts have less direct financial incentive to reduce absence than under attendance-based models, though the plan includes weighted funding for at-risk students that could theoretically support attendance interventions.
What the data cannot show
School-level chronic absenteeism data in Nevada comes with significant limitations. The statewide rate used here is an unweighted mean of school-level rates, which gives equal influence to a 50-student rural school and a 2,500-student Clark County high school. Enrollment-weighted calculations are only possible for 2025, when Nevada first reported enrollment alongside chronic rates. That weighted rate for 2025 is 32.6%, close to but not identical to the 31.7% unweighted mean.
The COVID gap in the data, with no 2019-20 reporting, means we are measuring the 2025 reversal against a trajectory that includes an unmeasured year. And the methodology break in 2025 racial subgroup reporting makes demographic analysis of the reversal unreliable.
What is reliable: the direction. Thirteen of 17 districts worsened. The statewide mean rose. The recovery curve bent the wrong way. After two years of cautious optimism, Nevada's attendance crisis is not over.
Detailed code that reproduces the analysis and figures in this article is available exclusively to EdTribune subscribers.
Discussion
Sign in to join the discussion.
Loading comments...