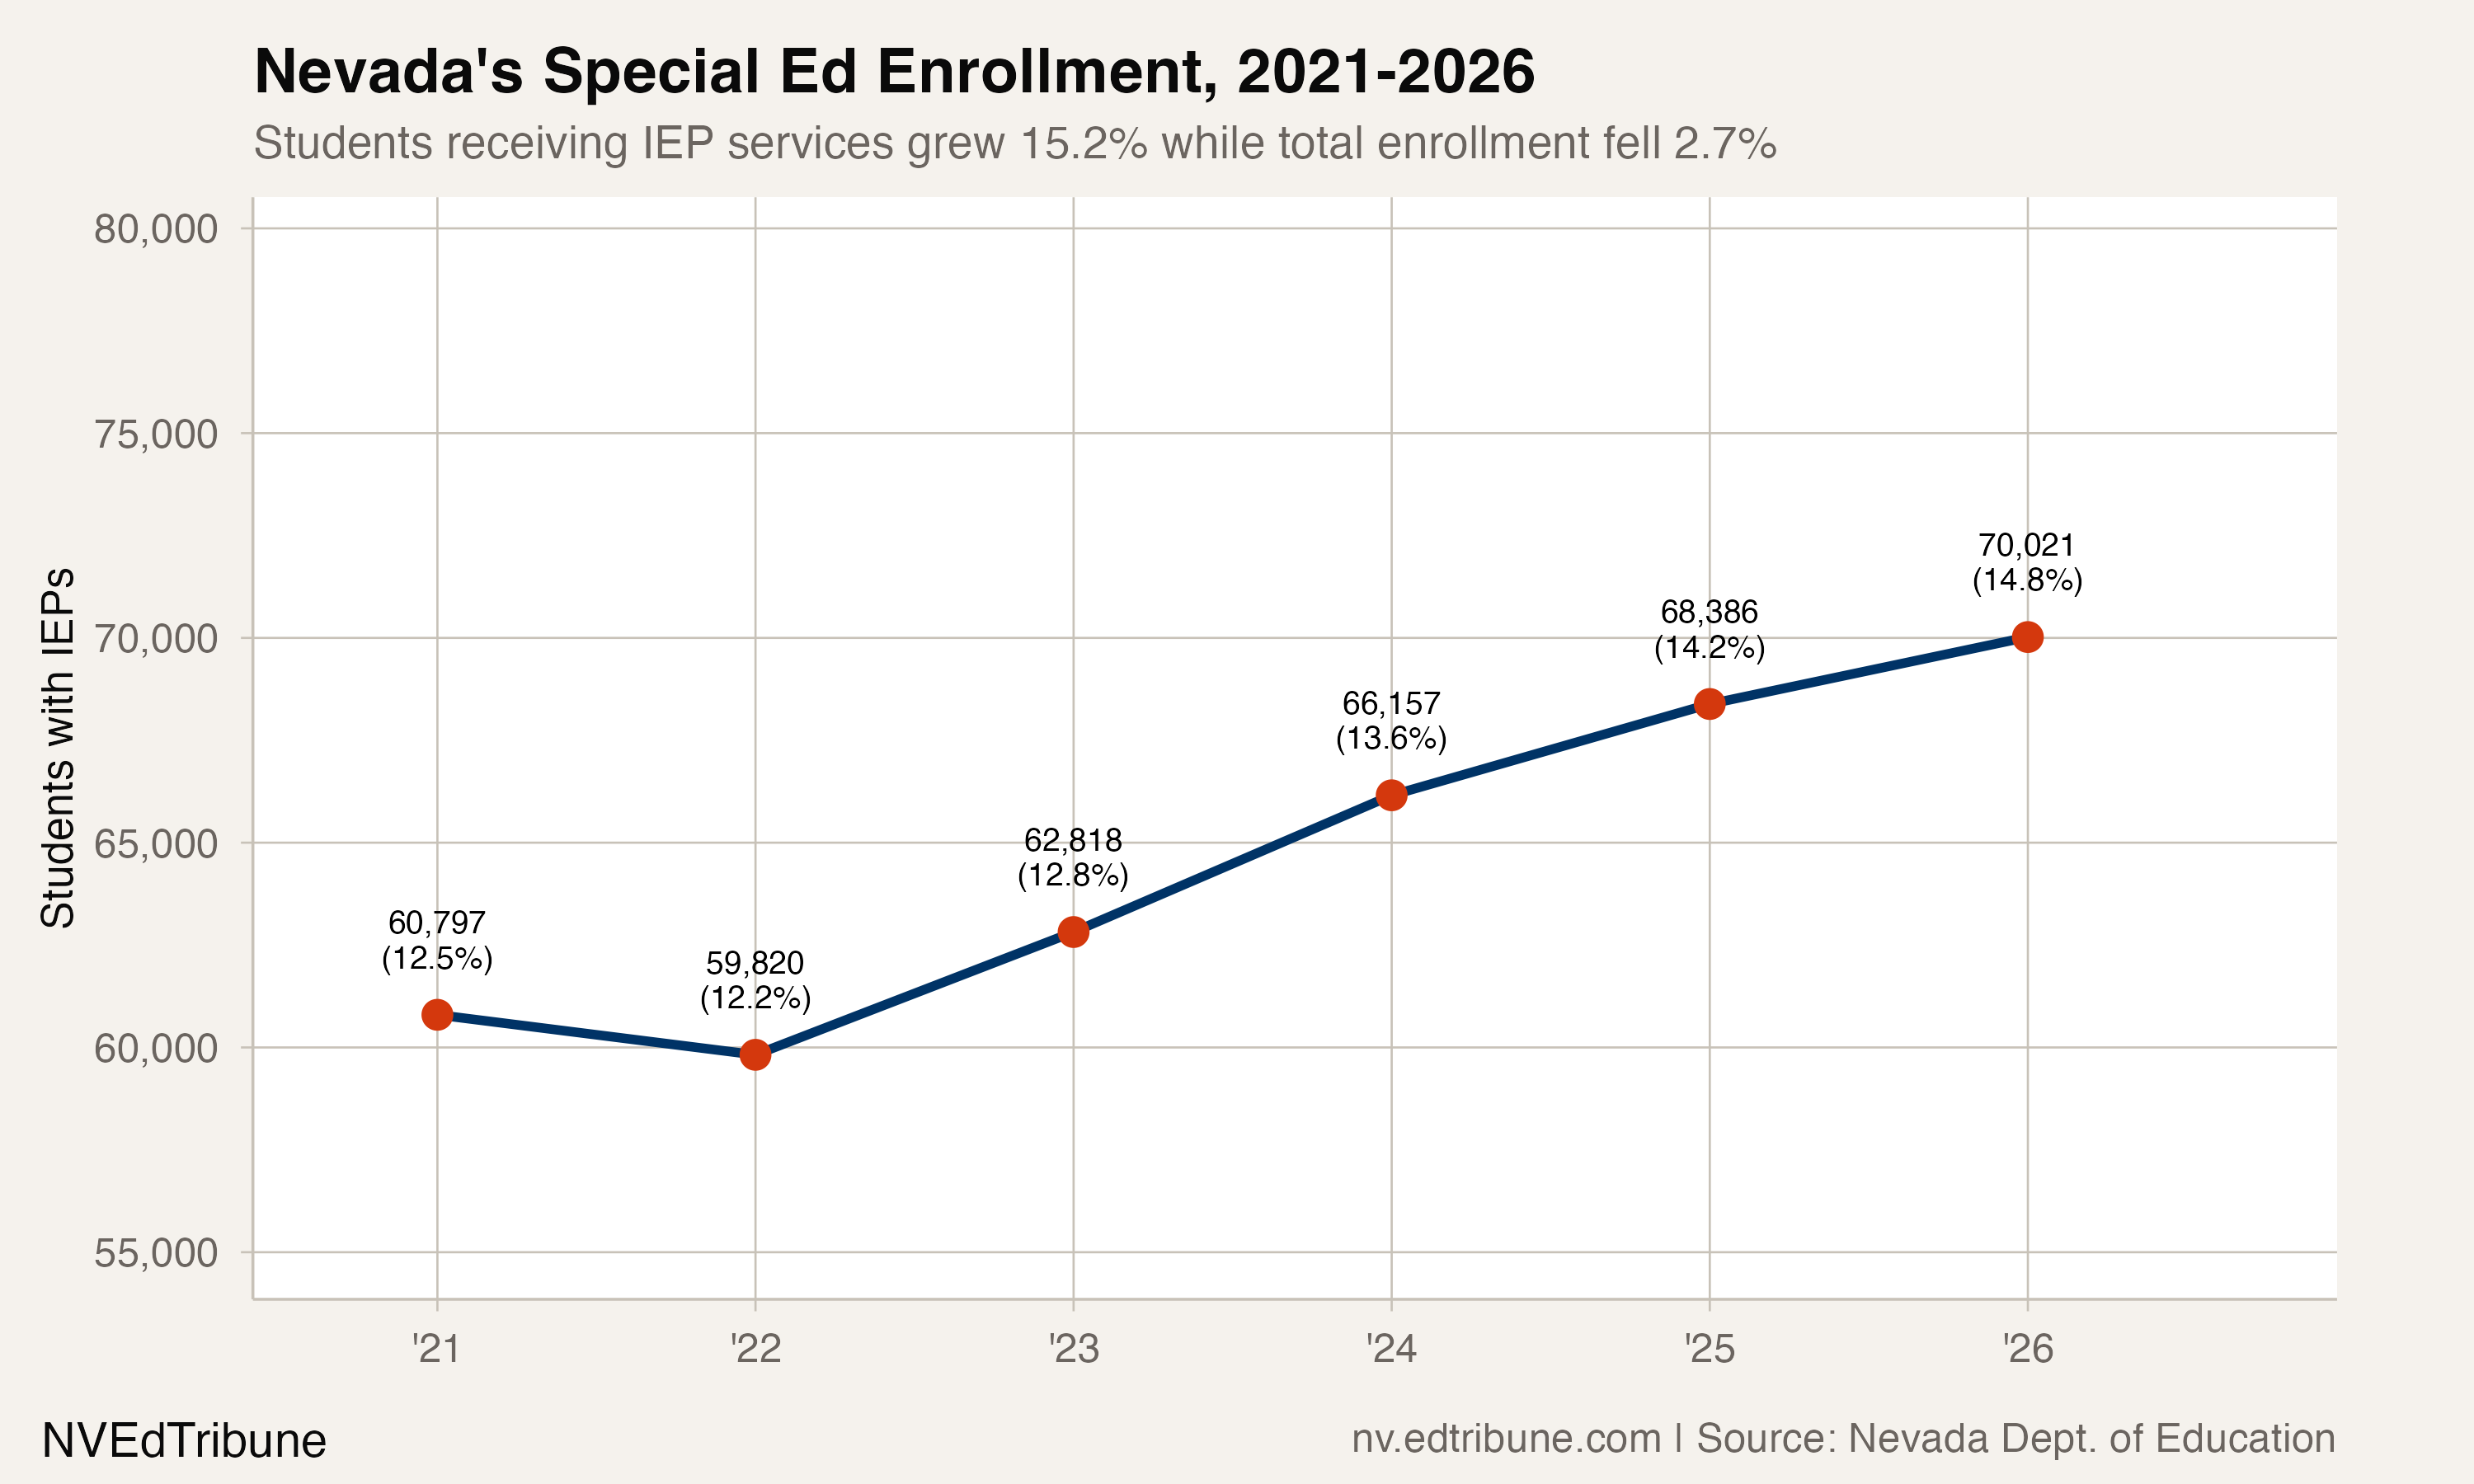
Five years ago, roughly one in eight Nevada public school students had an Individualized Education Program. By 2025-26, that figure was closer to one in seven. The state added 9,224 students receiving special education services between 2020-21 and 2025-26, a 15.2% increase, even as overall enrollment dropped by nearly 13,000 students. The result is a rate that has climbed from 12.5% to 14.8%, a 2.3 percentage-point jump that amounts to the fastest compositional shift in Nevada's enrollment data.
The growth is not a rounding error. Nevada's special education enrollment now stands at 70,021 students, up from 60,797 in 2020-21. For context, the 9,224-student increase in IEP rolls equals 71.1% of the state's total enrollment loss over the same period. The system is shrinking, but the share of students entitled to the most resource-intensive services is growing.
The two forces compressing the system
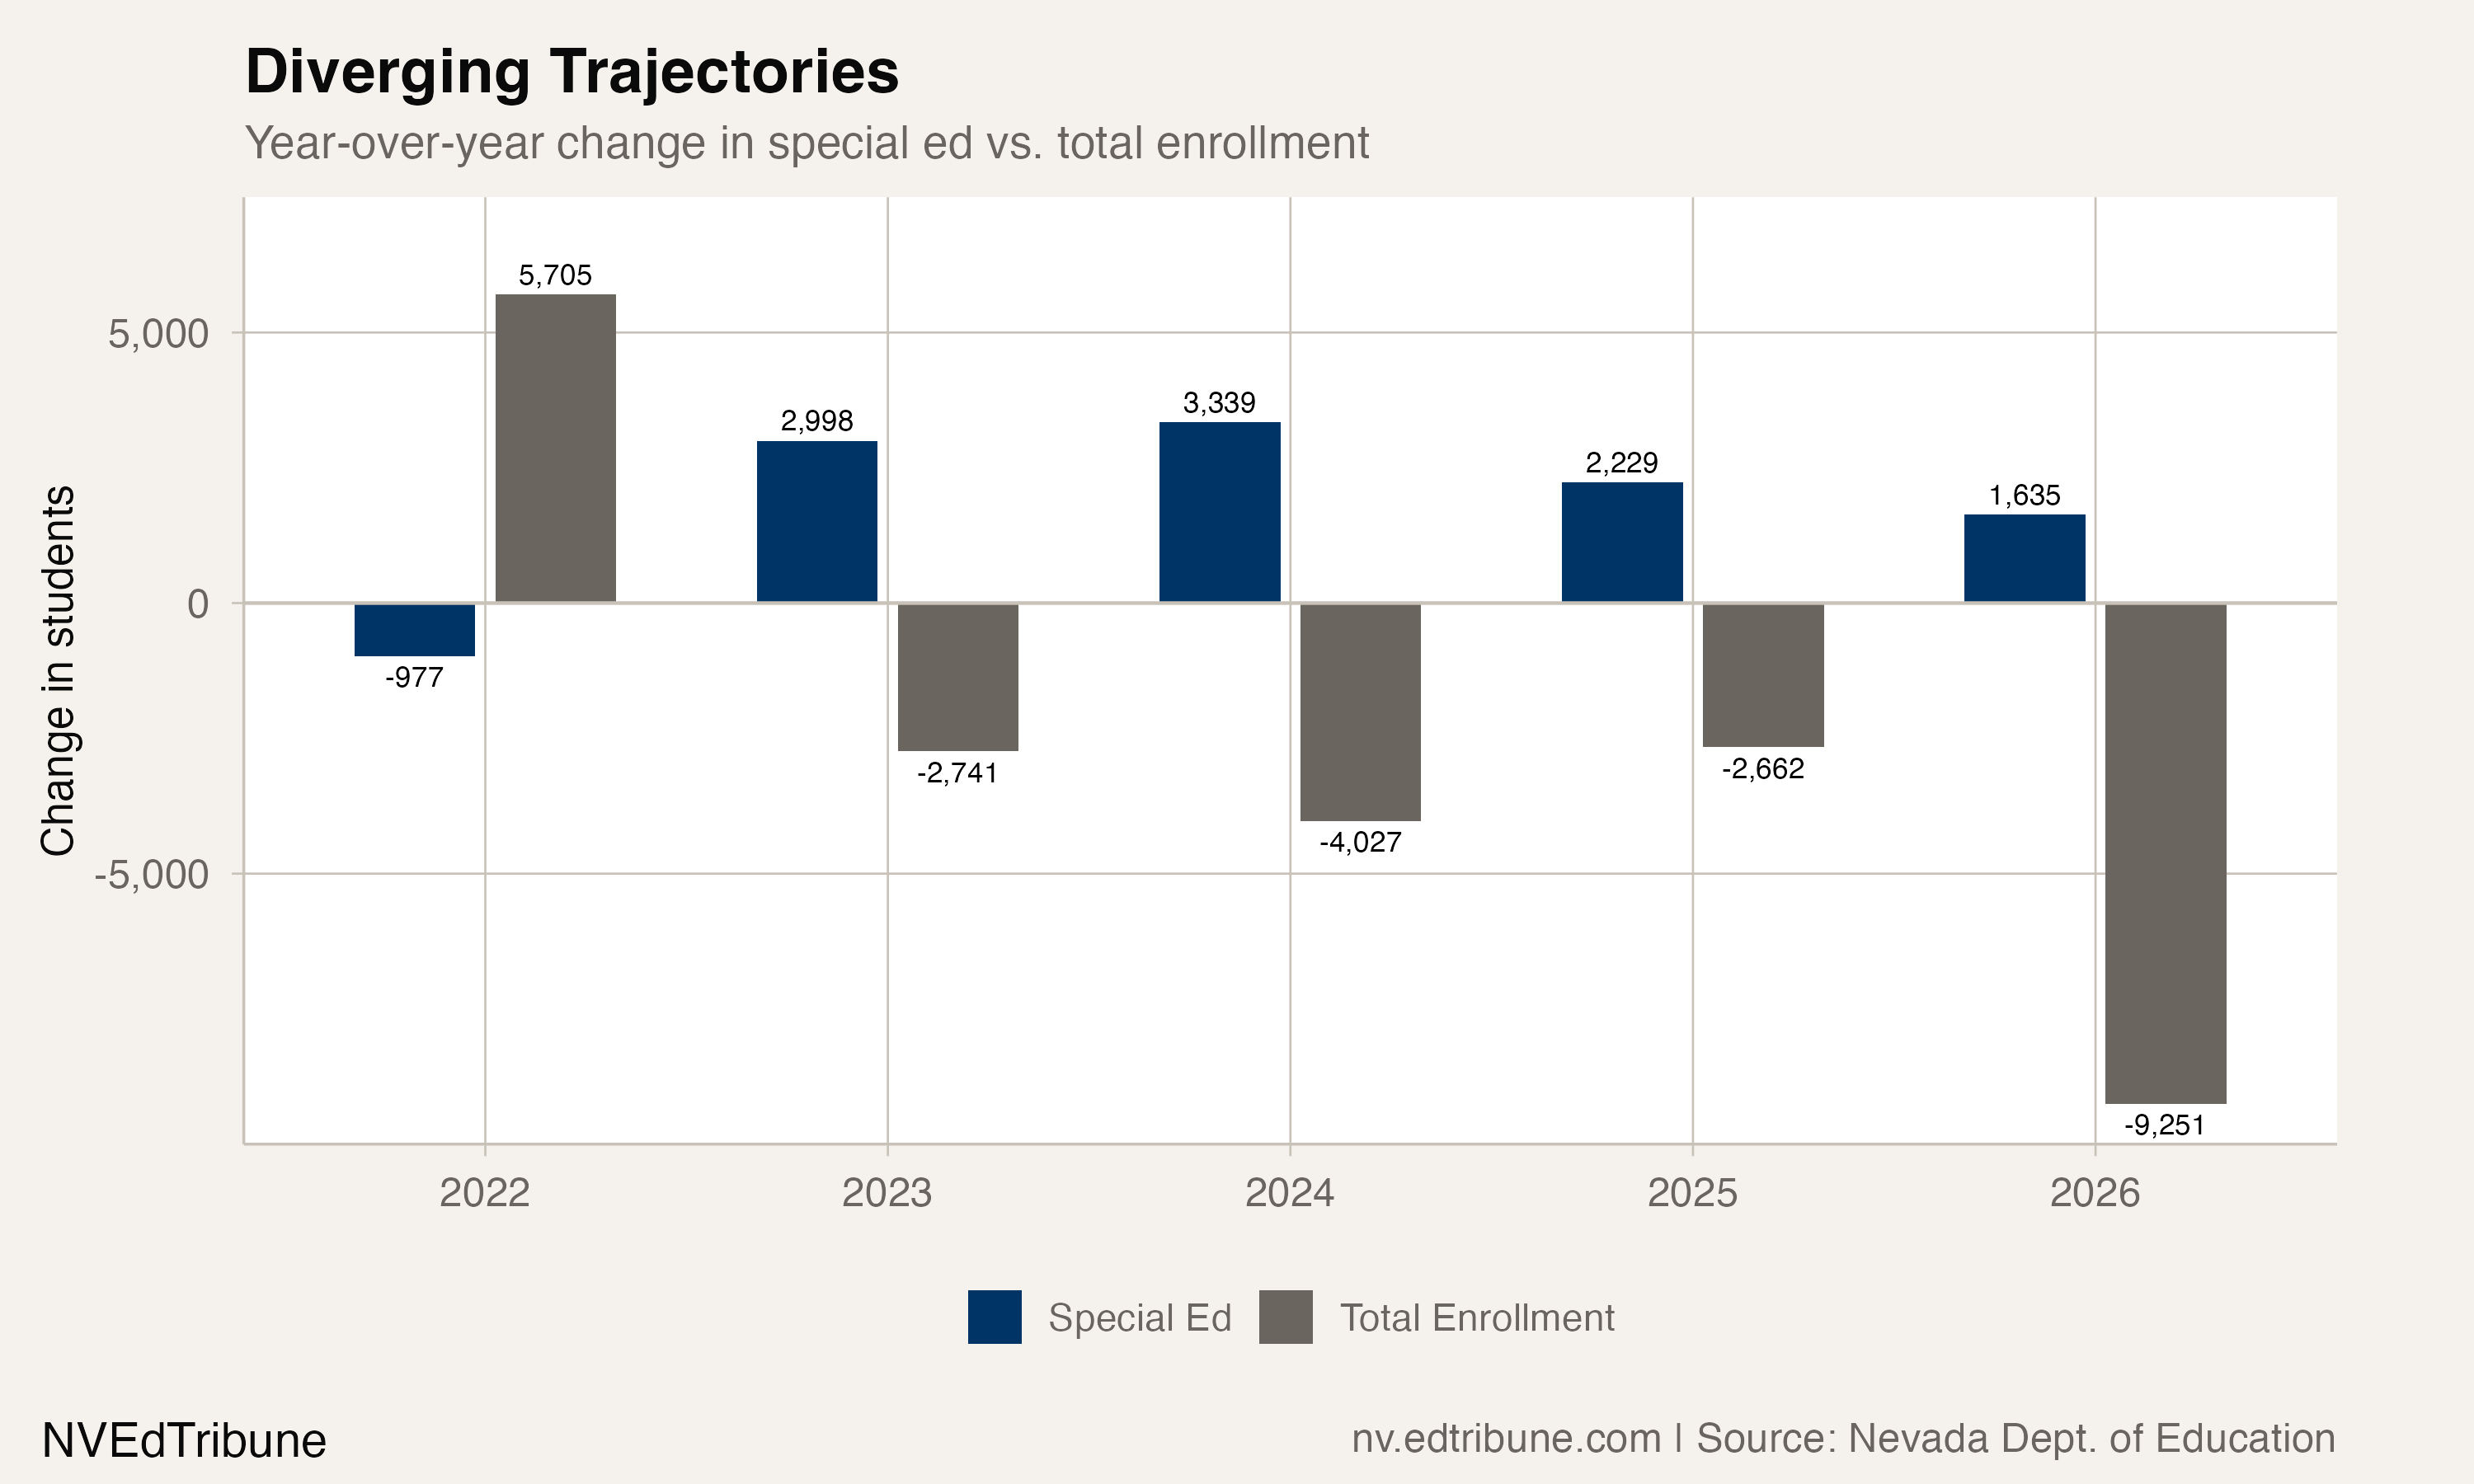
The rate increase has two drivers, and neither alone would produce this trajectory. Special education counts are rising in absolute terms while the denominator, total enrollment, is falling. In 2025-26 alone, Nevada lost 9,251 students from its overall rolls while adding 1,635 to its IEP caseloads. The year before, total enrollment fell by 2,662 while special education grew by 2,229.
This creates a compounding effect. Even if special education enrollment had held flat at 60,797, the rate would have risen from 12.5% to 12.8% simply because total enrollment shrank. But special education did not hold flat. It grew by 15.2%, accelerating the rate increase well beyond what the denominator alone would produce.
The pattern has a notable wrinkle. In 2021-22, special education enrollment actually fell by 977 students, the only year in the series with a decline. Clark County School District↗ET accounted for the entire dip and then some, dropping 1,303 IEP students in a single year. The most likely explanation is a pandemic-era evaluation backlog: students who would have been identified in 2020-21 or 2021-22 were not evaluated on time, and their referrals stacked into subsequent years. A study of Washington state schools found roughly 8,000 elementary students missed identification between March 2020 and March 2022, a 20% drop from expected levels. Schools there addressed about two-thirds of the backlog once evaluations resumed.
Nevada's rebound after the 2022 dip was sharp: nearly 3,000 new IEP students in 2022-23, followed by 3,339 more in 2023-24. The pace has since slowed to 2,229 in 2024-25 and 1,635 in 2025-26, suggesting the catch-up effect is tapering while a baseline upward trend continues.
Clark County absorbs the largest share
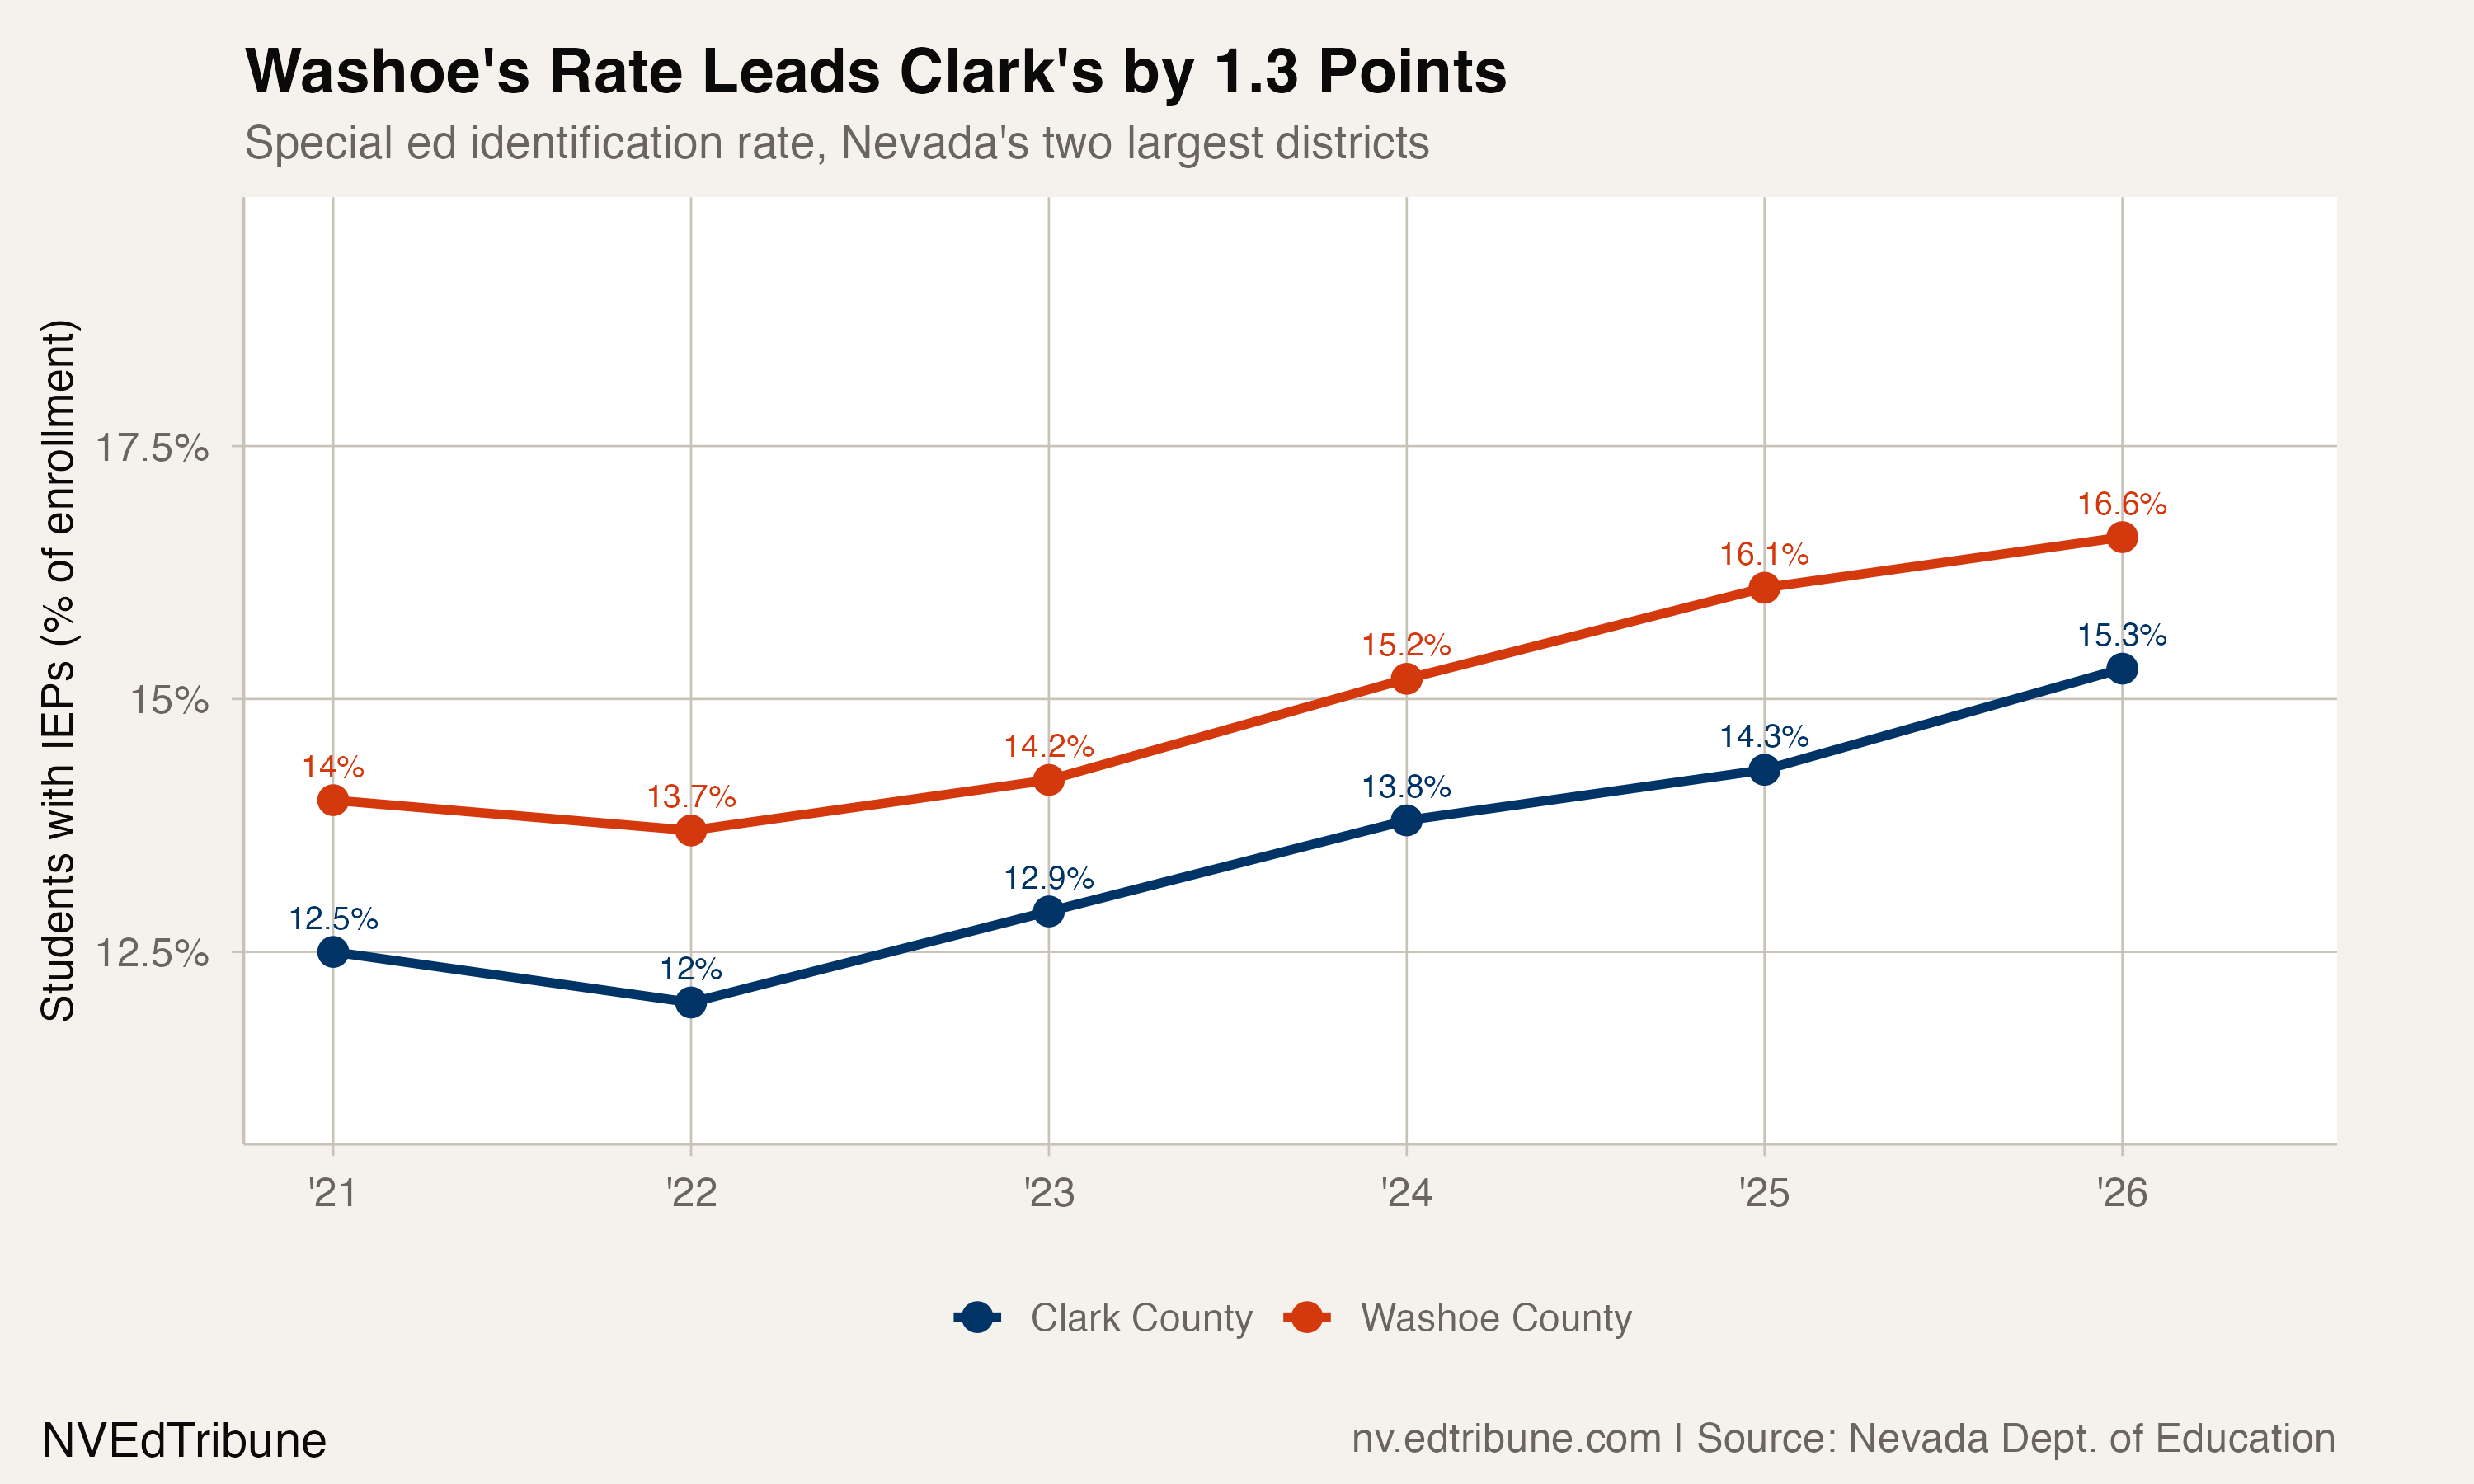
Clark County added 4,710 special education students between 2020-21 and 2025-26 while losing 27,706 students from its total enrollment. The district's IEP rate jumped from 12.5% to 15.3%, a 2.8 percentage-point increase. Put differently, Clark now has more students with IEPs (44,484) than it had total enrollment in many rural Nevada counties combined.
Washoe County School District↗ET identifies students at an even higher rate. Its 16.6% IEP rate in 2025-26, up from 14.0% in 2020-21, exceeds Clark's by 1.3 percentage points. Washoe added 1,456 special education students over the period while its total enrollment slipped from 64,988 to 63,655.
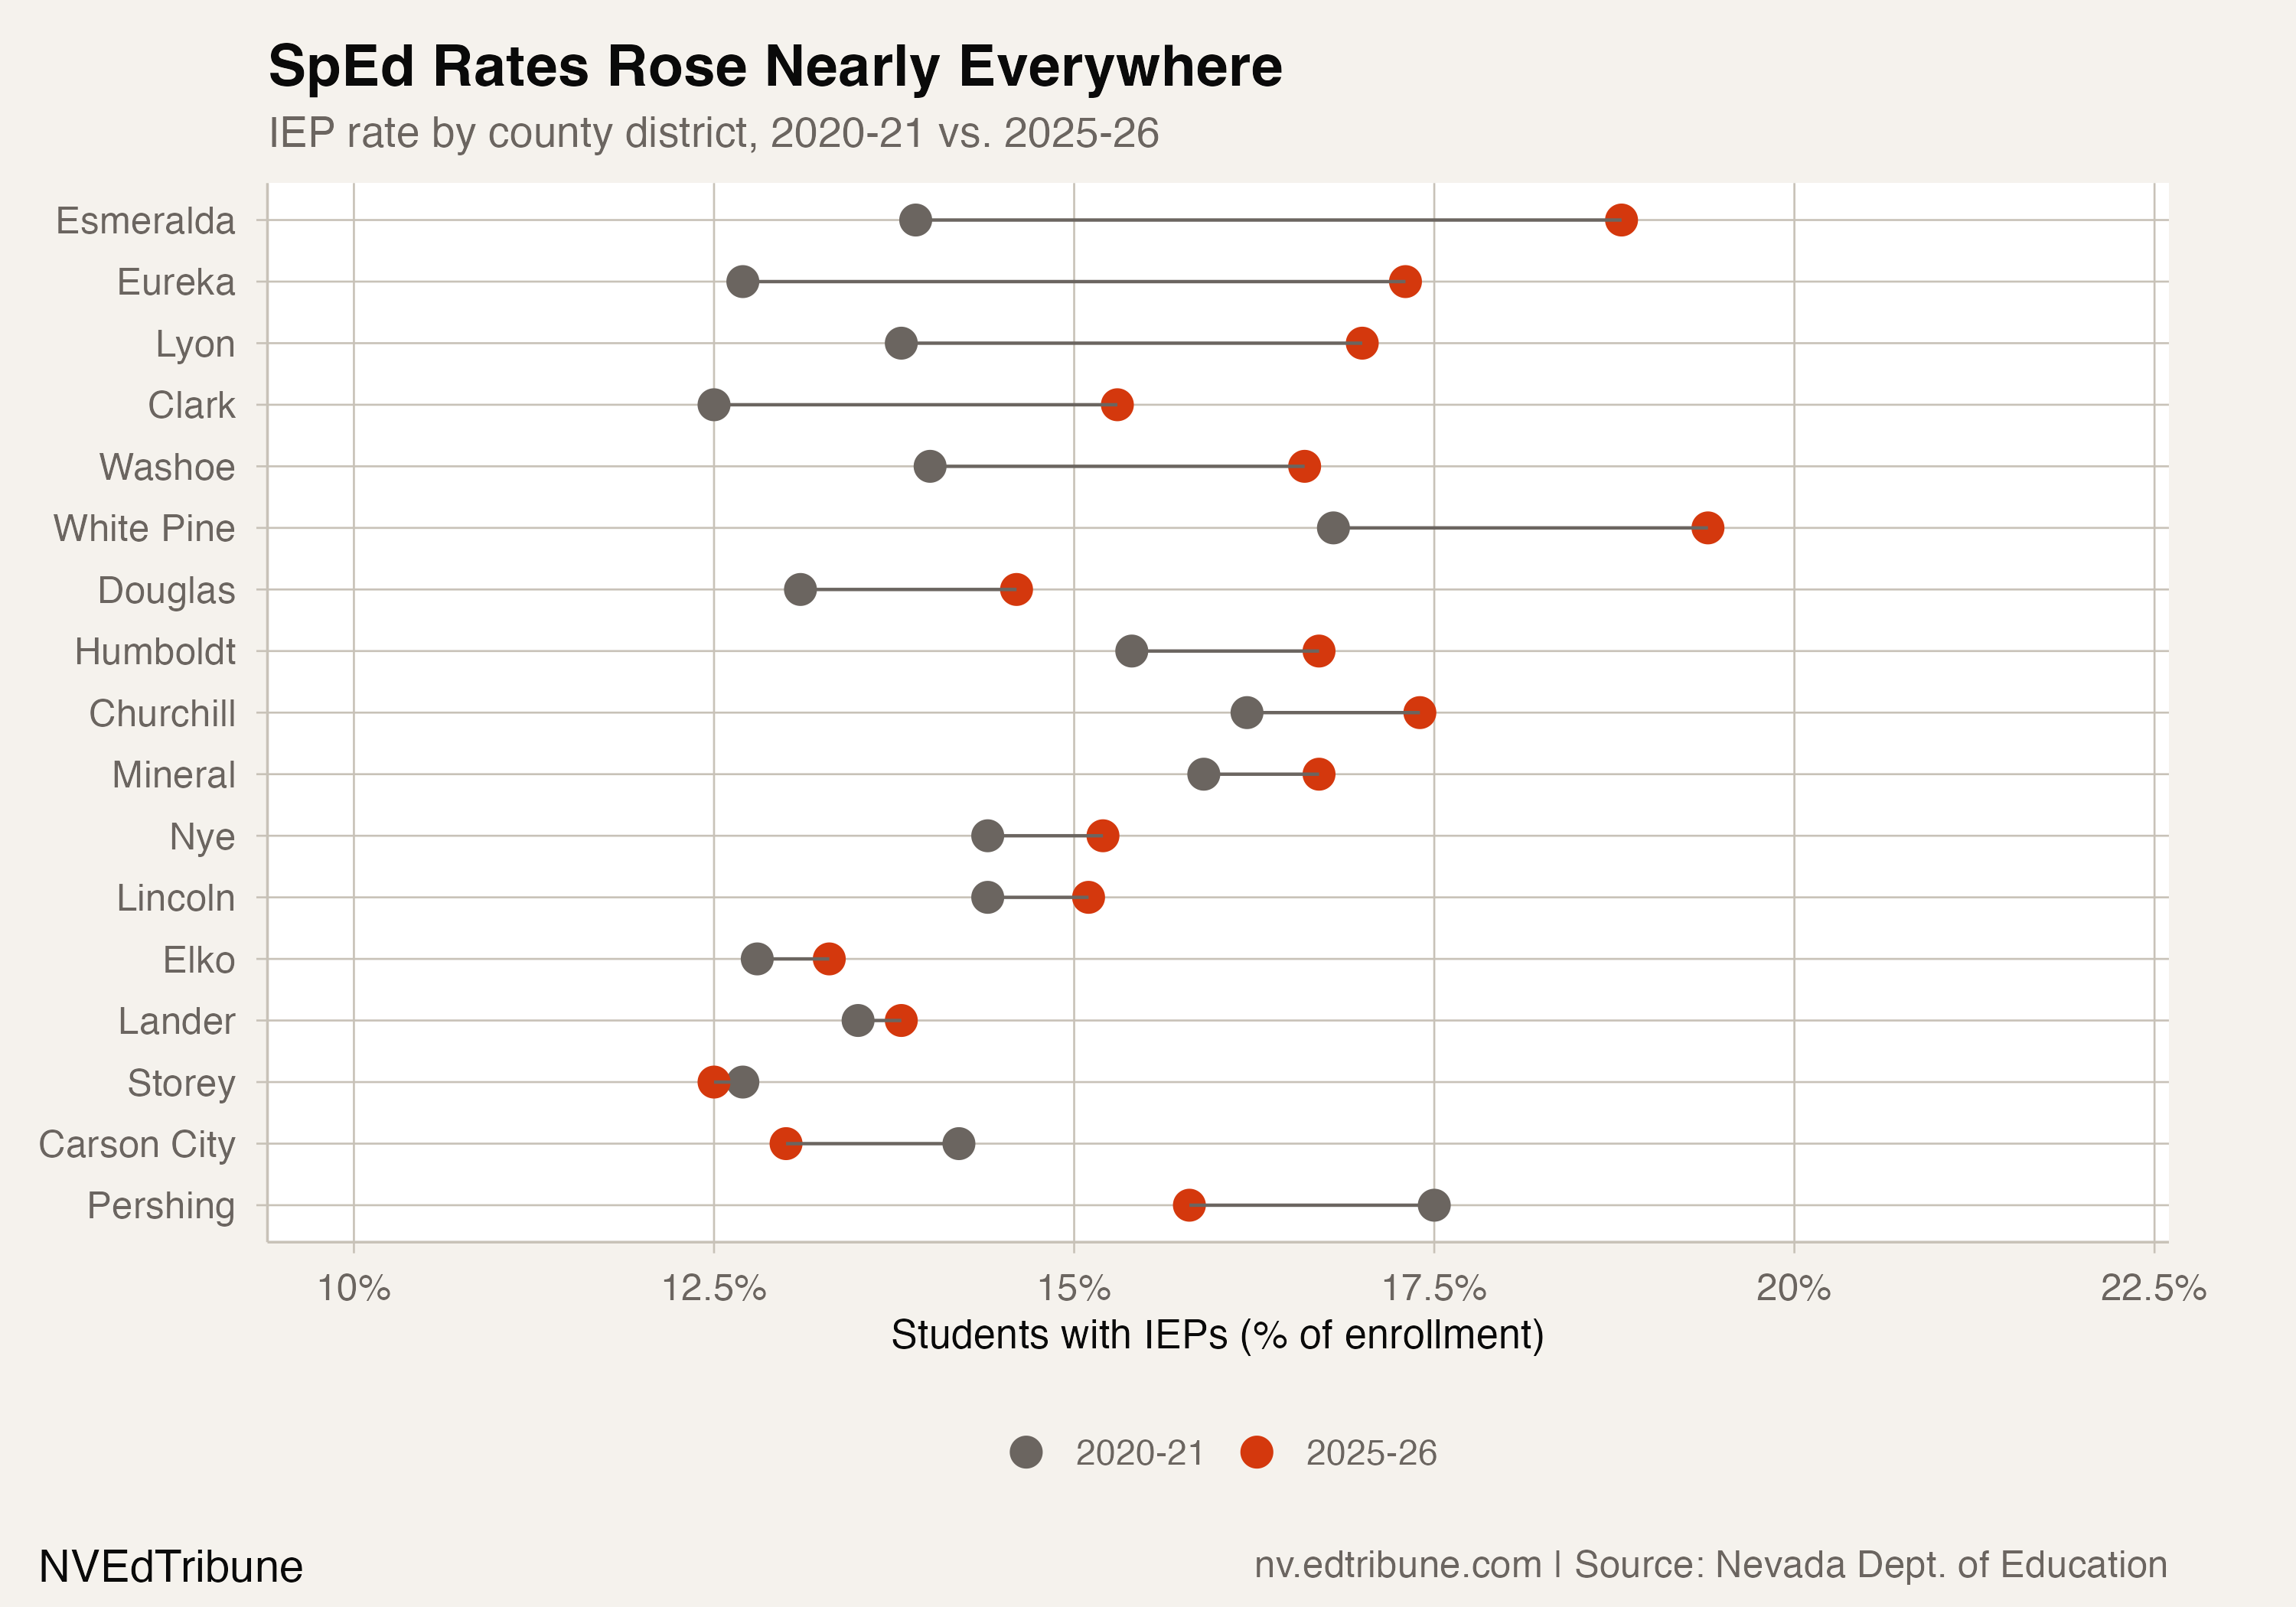
Among smaller county districts, the pattern is nearly universal. Fourteen of Nevada's 17 county districts saw their special education rate rise between 2020-21 and 2025-26. Twelve now exceed 15%. Lyon County posted the largest rate increase among mid-sized districts, climbing from 13.8% to 17.0% as it added 323 students to its IEP rolls. Only Carson City, Pershing County, and Storey County saw their rates fall, Carson City declining from 14.2% to 13.0%.
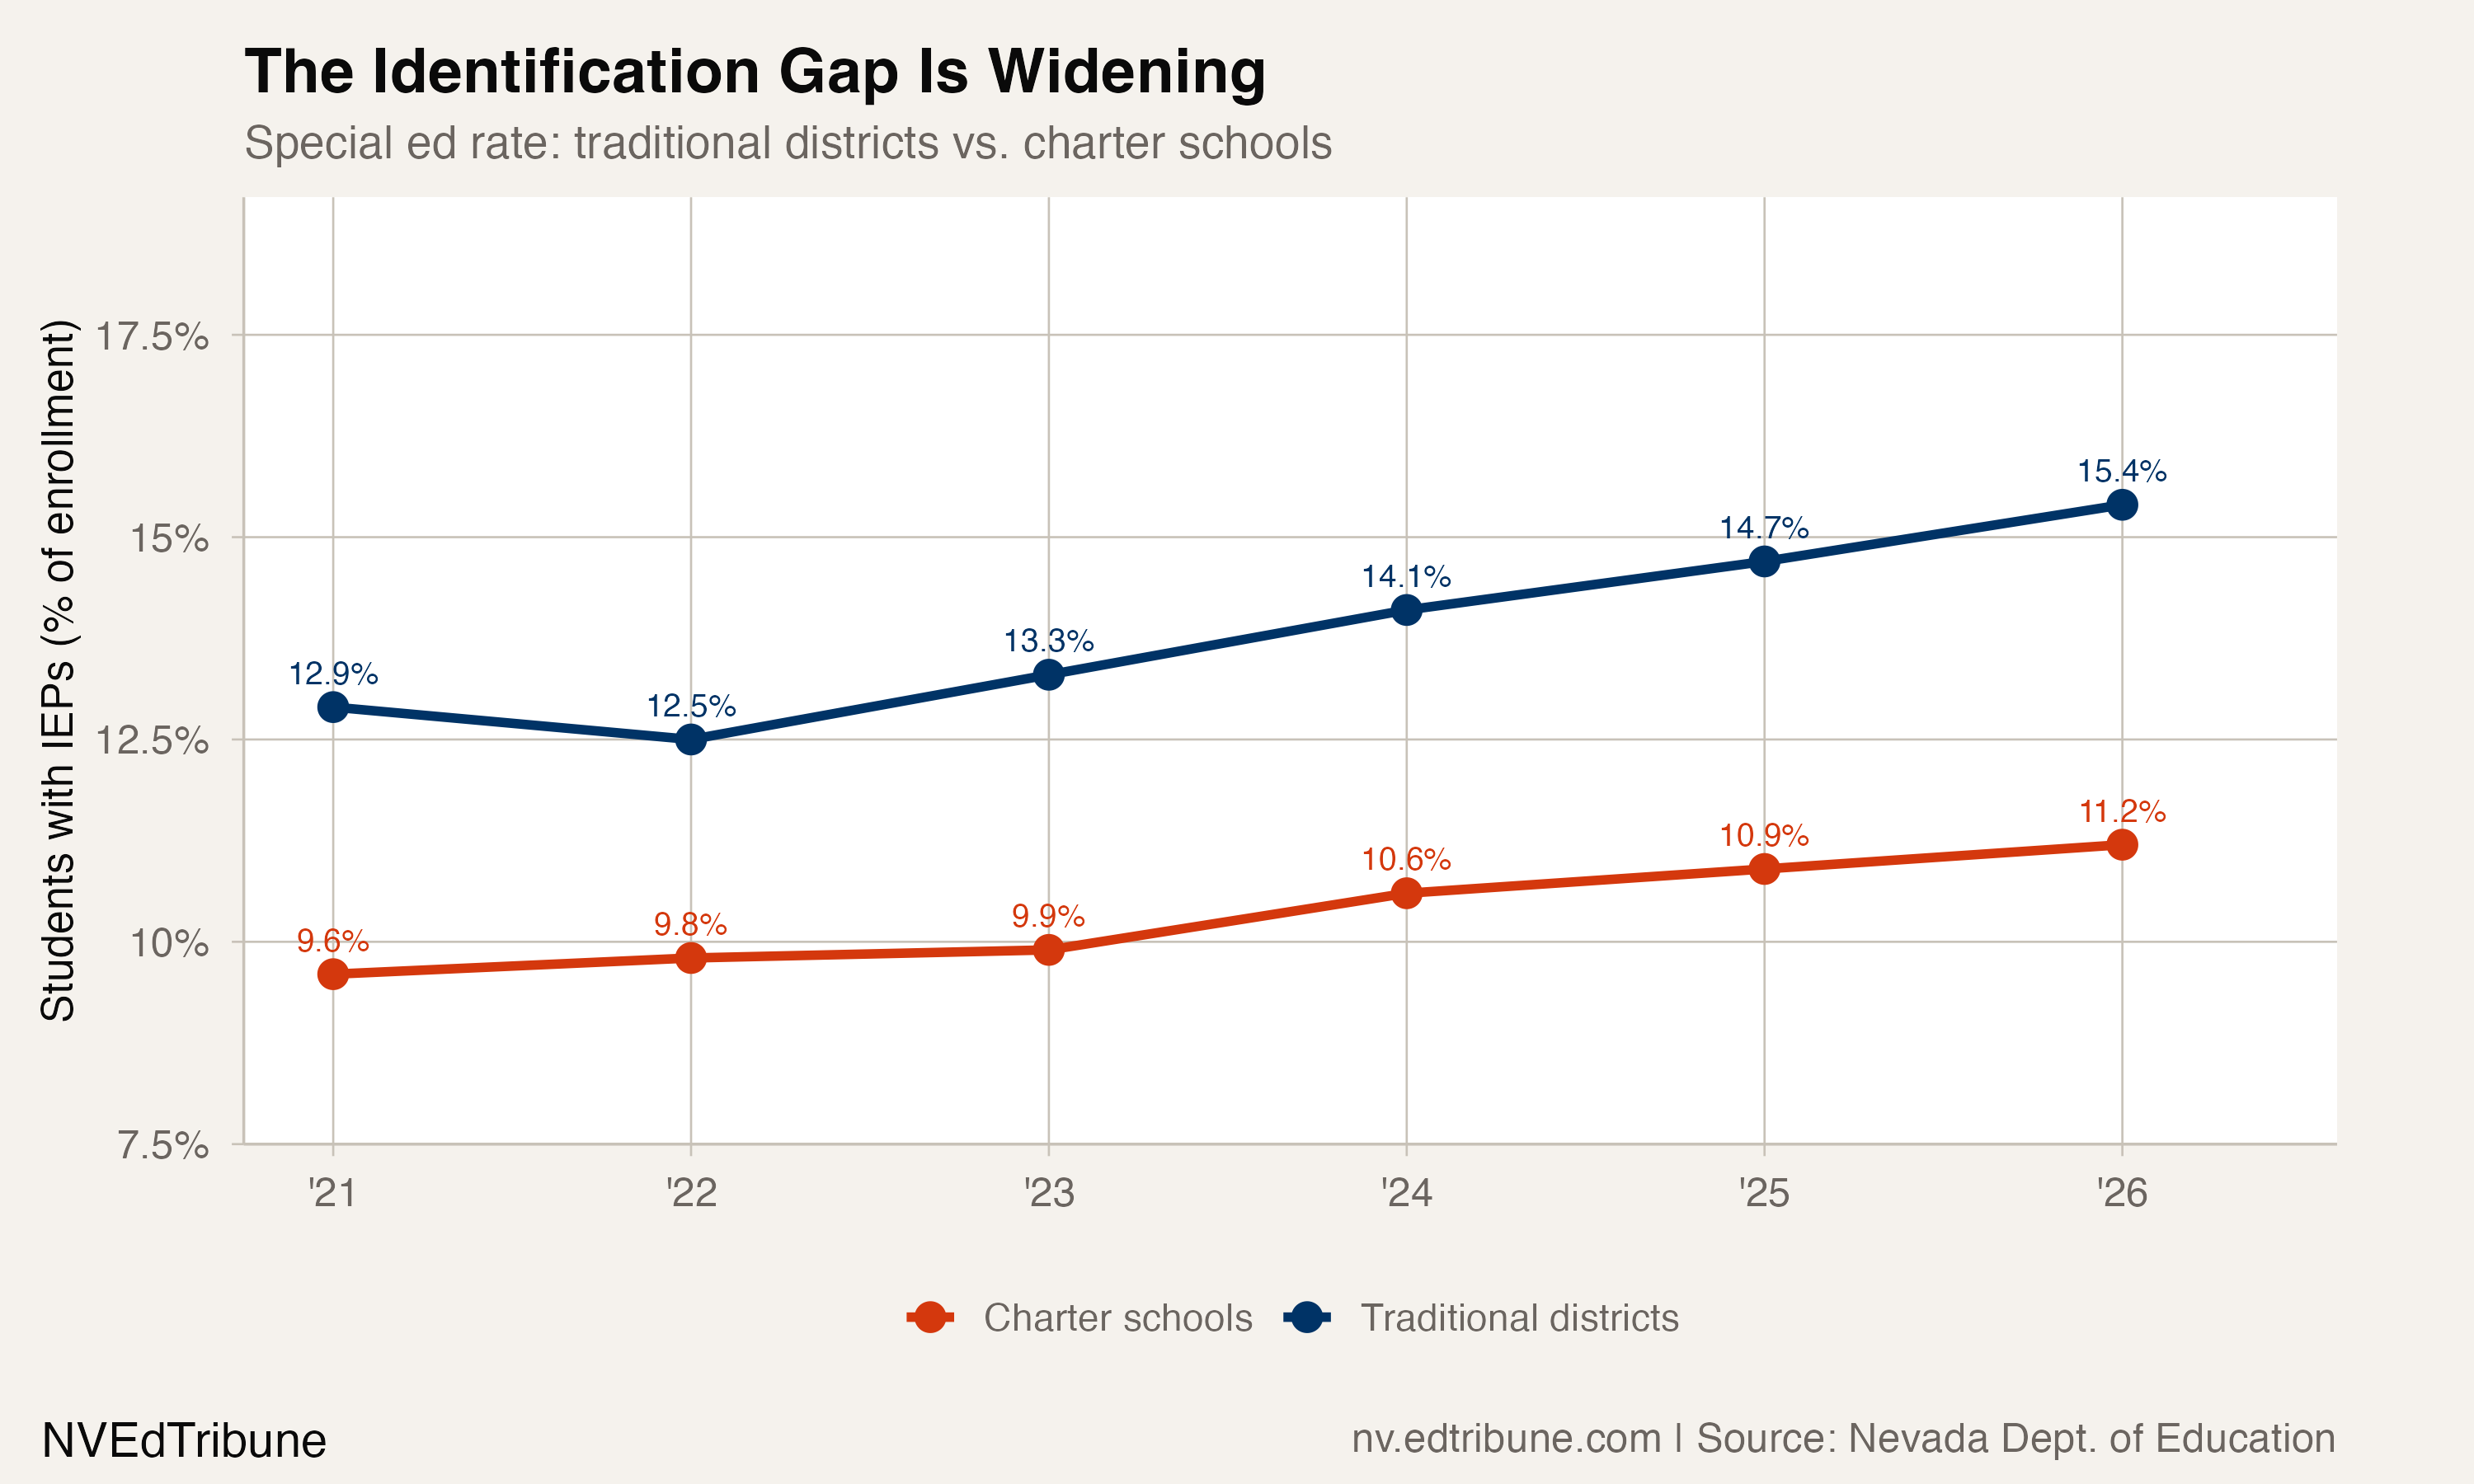
Charter schools identify at lower rates, and the gap is growing
Nevada's charter sector identifies 11.2% of its students for special education, compared to 15.4% in traditional districts. That 4.2 percentage-point gap has widened every year since 2022, when it stood at 2.7 points.
The divergence has at least two plausible explanations, and disentangling them from enrollment data alone is not possible. One is structural: charter schools often lack the specialized staff and facilities to serve students with significant disabilities, which may discourage enrollment or referral. Even in the traditional sector, a pending class action lawsuit alleges Clark County School District has failed to provide federally required special education services, suggesting that identification and service capacity are strained system-wide.
The other explanation is compositional. Families of students who already have IEPs may be less likely to apply to charter schools, knowing that the receiving school may not have the same support infrastructure. The data cannot distinguish between under-identification at charters and self-selection by families.
A national pattern with local budget consequences
Nevada's trend is consistent with a nationwide surge. Nationally, nearly 8.2 million children ages 3 to 21 qualified for special education in 2024, an increase of more than 300,000 in a single year. Autism diagnoses accounted for 40% of that national growth. Nevada's 2022-23 rate of 13% was below the national average of 15%, according to the National Center for Education Statistics, which means the state may still have room for further increases as identification practices catch up with national norms.
The fiscal arithmetic is straightforward. Federal IDEA funding covered approximately $97 million for Nevada in 2024, roughly $1,385 per student receiving special education. The instructional programs these students receive carry per-pupil costs well above the base amount. Federal IDEA dollars covered only about 11% of the additional cost of educating a student with a disability in Nevada, according to a Brookings analysis, leaving state and local budgets to absorb the rest. As the IEP share rises from one in eight to one in seven students, the gap between what federal law mandates and what the funding covers widens proportionally.
The staffing picture compounds the budget pressure. When Clark County opened the 2025-26 school year, 163 of its 320 classroom vacancies were in special education. That was a significant improvement from over 300 special education vacancies two years earlier, helped by a 2023 state law that raised teacher pay and directed $45 million annually toward hard-to-fill positions. But hiring 163 fewer vacant positions into a system adding 1,600 new IEP students per year means the staffing gains are running behind the demand curve.
"We laid off the department that oversees that funding, that is then distributed. So, is it going to go to another department who's going to handle it?" — Michelle Booth, Educate Nevada Now, quoted by News3 Las Vegas, March 2025
The federal uncertainty adds a layer of risk. The U.S. Department of Education laid off nearly all staff in the Office of Special Education and Rehabilitative Services in early 2025. Nevada had received approximately $33 million of its projected $96.8 million in IDEA funding at the time of the layoffs, with the remainder expected imminently. Whether that pipeline remains intact is an open question that every district with a growing IEP caseload is watching.
What the identification rate does not reveal
A rising IEP rate can mean different things. It can mean more students genuinely need services, perhaps because pandemic-era disruptions left lasting developmental impacts. It can mean schools are getting better at finding students who always needed services but were previously overlooked. Or it can mean classification thresholds have shifted, with the same students newly qualifying under broader criteria. The enrollment data alone cannot distinguish these mechanisms.
Nevada's trajectory, a dip in 2022 followed by four years of sustained growth, is most consistent with a catch-up hypothesis layered on top of a genuine increase. The initial dip matches the pattern of delayed evaluations documented in other states, and the subsequent surge overshoots the pre-pandemic baseline, suggesting both backlog clearance and new underlying demand.
The state still identifies students at a rate below the national average, which raises a discomforting possibility: the surge may not be over. If Nevada's identification practices continue converging toward national norms, the 14.8% rate could climb further even without any change in the actual prevalence of disabilities. For a system already grappling with teacher shortages and enrollment-driven budget cuts, the difference between 1 in 7 and 1 in 6 is not an abstraction. It is a line item.
Detailed code that reproduces the analysis and figures in this article is available exclusively to EdTribune subscribers.
Discussion
Sign in to join the discussion.
Loading comments...